
Abstarct
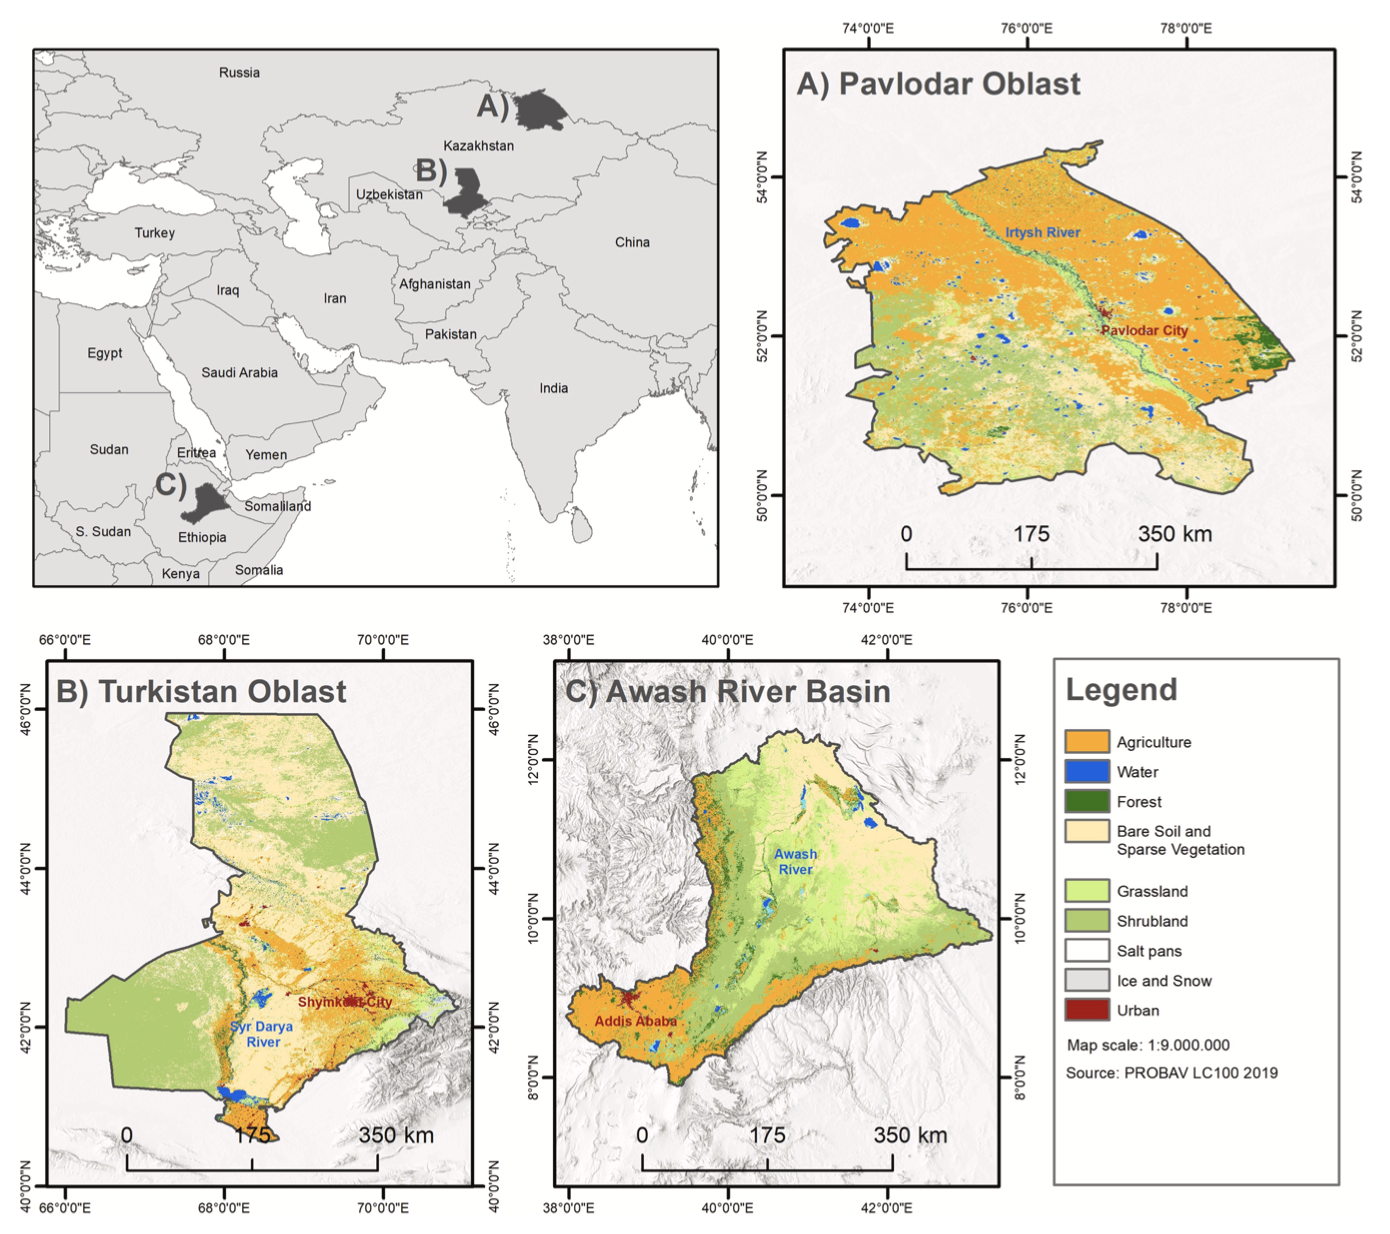
In this study, we present a fused multi-scale approach to model habitat suitability index (HSI) maps for three different locust species. The presented methodology was applied for the Italian locust (Calliptamus italicus, CIT) in Pavlodar oblast, Northern Kazakhstan, for the Moroccan locust (Dociostaurus maroccanus, DMA) in Turkistan oblast, South Kazakhstan and for the desert locust (Schistocerca gregaria) in Awash river basin, Ethiopia, Djibouti, Somalia.
The main novelty is based on implementing results from ecological niche modelling (ENM) with time- series analyses of high spatial resolution remote sensing data (Sentinel-2) and further auxiliary datasets in a fused HSI model. Within the ENM important climatic variables (e.g. temperature, rainfall) and edaphic variables (e.g. sand and moisture contents) are included at a coarse spatial resolution. The analyses of Sentinel-2 time-series data enables mapping locust breeding habitats based on recent remotely sensed land observation at high spatial resolution and mirror the actual vegetation state, land use, land cover and in this way identify areas with favorable conditions for egg survival and breeding. The fused HSI results for year 2019 were validated based on ground field observation and reach area under curve (AUC) performance of 0.747% for CIT, 0.850% for DMA and 0.801% for desert locust. The innovation of this study is a multi-scale approach which accounts not only for climatic and environmental conditions but also for current vegetation and land management situation. This kind of up-to-date spatial detailed information on breeding suitability could enable area prioritization for risk assessment, monitoring and early intervention of locust pests.
Authors: Igor Kleina – a, Sietse van der Woudea – a, b, Frederic Schwarzenbachera – a, f, Nadiya Muratova – c, Bart Slagter – a, b, Dmitry Malakhov – d, Natascha Oppelt – e, Claudia Kuenzer – a, f
a – German Remote Sensing Data Center (DFD), German Aerospace Center (DLR), 82234 Wessling, Germany
b – Wageningen University & Research (WUR), the Netherlands
c – Research Institute of Ecological Problems, Al-Farabi Kazakh National University, Almaty 050010, Kazakhstan d Joint Stock Company “National Center for Space Research and Technology”, Almaty 050010, Kazakhstan
e – Department of Geography, Kiel University, 24118 Kiel, Germany
f – Institute of Geography and Geology, University of Wuerzburg, 97074 Wuerzburg, Germany
Keywords: Locust breeding habitat, Incubation of egg-pods, Ecological niche model, Habitat suitability index, Locust monitoring, Remote sensing, Sentinel-2
![]() To download full version of article in PDF format – open in new tab
To download full version of article in PDF format – open in new tab
Introduction
Since the beginning of land cultivation locust outbreaks, and plagues have been a danger to the human population worldwide and often brought devastation, hunger and death (Zhang et al., 2019). All conti- nents except for Antarctica have been infested by different locust spe- cies, which are capable to affect the livelihood of approximately 10% of the global population (Latchininsky and Sivanpillai, 2010). Recently, swarms of desert locusts (Schistocerca gregaria) endanger food security across East Africa, the Arabic peninsula, India and Pakistan (Meynard et al., 2020). Other species e.g. Italian locust (Calliptamus italicus, CIT) and Moroccan locust (Dociostaurus maroccanus, DMA) can also cause massive devastation at regional and local scales (Kambulin, 2018; Latchininsky, 1998; Le Gall et al., 2019; Reuters, 2019; Toleubayev et al., 2007). In gregarious phase, locusts can damage crops and pasture massively, since they eat an equivalent of their body mass in green vegetation every day (Steedman, 1990; Uvarov, 1957). The loss of biomass is not only of economic importance, but also endangers food security, livestock and other fauna species. Furthermore, plants them- selves are harmed and inhibited in natural regeneration due to the consumption of seeds and sprouts by locust bands (Kambulin, 2018). Nevertheless, in solitary phase, locusts are a beneficial part of an ecosystem by facilitating nutrient cycling and playing an important role in the food chain (Tsychuyeva et al., 2017). Unusual weather conditions, subsequent droughts and scarcity of plant food force the insects to aggregate, initiating the gregarious phase in which locusts create bands and form highly mobile flying swarms of adult insects (Kimathi et al., 2020; Meynard et al., 2020). Locust population densities or states are commonly distinguished by the definitions of outbreak, plague or pest, decline and recession (Cressman, 2016).
Countries at risk of locust outbreaks usually possess regional and national monitoring systems. The Australian Plague Locust Commission (APLC) operates successfully by implementing weather forcast, remote sensing and ground observation (Hunter, 2004; Hunter et al., 2008). The Food and Agriculture Organization (FAO) of the United Nations operates the Desert Locust Information Service (DLIS) in close cooperation with involved countries (FAO, 2009). Furthermore, similar efforts are made for Central Asia and the Caucasus region where Italian, Moroccan and Asian migratory locusts have to be monitored and controlled (FAO, 2021a). One of the major goals of locust monitoring is assessing the geographic extent of possible breeding areas, highlighting gregarization hot spots, evaluation of population parameters and accordingly initi- ating control activities. Despite the danger of gregarious locusts for food security, the ability to predict and manage locust outbreaks is still insufficient (Latchininsky, 2013). Detailed spatial knowledge about lo- cust habitats and suitable breeding areas with high probability of eggs surviving are of major importance for regional and national plant pro- tection and locust monitoring organizations because it demands a lot of financial means, manpower and time. In this context, remote sensing data and applications proved great potential as an additional source because they perform efficient, more economical, with less manpower and are regardless of national borders (Kambulin, 2018). Since the 1970ies remote sensing data are used e.g. for locust habitat mapping mainly for the desert locust, migratory locust and Australian plague locust but with only very few studies for CIT and DMA (Klein et al., 2021; Latchininsky et al., 2016; Latchininsky, 2013). Sivanpillai et al. (2009) applied IRS-S WiFS data with 56 m spatial resolution for a habitat model of CIT in the North-East of Kazakhstan. The results were prom- ising and the authors identify the benefit of higher spatial resolution satellite data. Latchininsky (2013) states the importance of model development for habitat mapping of CIT and DMA but saw the research still in the initial phase. Recent modelling applications on locust species distribution, ecological niche and habitat suitability present continuous development (Arago ́n et al., 2013; Go ́mez et al., 2019, 2018; Kimathi et al., 2020; Malakhov and Zlatanov, 2020; Piou et al., 2019, 2013; Veran et al., 2015). Availability of new datasets (e.g. soil moisture (Escorihuela et al., 2018; Piou et al., 2019)), methods and technological progress contribute to this steady improvement. For example, Ecological Niche Models (ENM) are based on machine learning algorithms to pre- dict suitable habitats from datasets describing environmental conditions and species presence and absence records. Within the ENM important climatic variables such as temperature, rainfall and edaphic variables such as sand, moisture contents are included at a coarse spatial resolu- tion from up to 1 km. The modelled results provide suitable areas at a larger geographic scale but usually do not discriminate higher spatial detail or account for land cover related characteristics. Nowadays, open source remote sensing data and cloud computing provide additional opportunities for modelling and monitoring of locust risks. Especially the use of temporally dense and high spatial resolution satellite data (e. g. Sentinel-1 and -2, Landsat) in combination with climate and envi- ronmental data can enable prediction in vulnerable areas with a high level of detail.
In this study, we present an approach based on habitat suitability index (HSI) model which takes advantage of different environmental variables, including ENM results, time-series analyses of satellite data and species-specific knowledge to better discriminate areas providing optimal locust breeding and egg-pod incubation conditions. For the ENM, we utilized up-to-date data from TerraClimate to account for recent climate conditions of last 20 years. Current vegetation state and land management conditions are targeted by the analysis of Sentinel-2 data. Additionally, unique species-dependent favorable and excluding conditions were considered. We applied the approach for three different locust species to demonstrate the advantages and challenges and, in this way, contribute to further development in this field. The study is con- ducted for CIT in North Kazakhstan (Pavlodar oblast), for DMA in South Kazakhstan (Turkistan oblast) and for desert locust in the Awash river basin (ARB), Ethiopia, Djibouti, Somalia. The results are validated with ground truth data collected by local organizations.
2. Background information on locust species and study areas
2.1. The Italian locust and Pavlodar oblast
The Italian locust was the first of all locust species recorded as a great pest in Russia in the year 1008 (FAO, 2021a). The species’ distribution area stretches from Western Europe across meadow steppes in Central Asia, Mongolia and West Siberia (Kambulin, 2018; Latchininsky, 2013). Although CIT is on the red list of endangered species in northern Europe, it is a threatening pests in Russia, Central Asia and the Caucasus (Latchininsky, 2013; Sergeev and Van’kova, 2008). Generally, the spe- cies can be found in arid steppes and semi-deserts, preferring vegetation such as wormwood and sagebrush (Artemisia spp., Monard et al., 2009). In addition, human-affected areas such as field borders, fallow fields and road edges can provide favorable conditions (Kambulin, 2018; Latch- ininsky, 2013; Sergeev et al., 2016). In such areas, CIT as herbivore inhabits fallow fields, field borders, waste lands and neglected orchards or Lucerne meadows, sometimes with saline soil (Sergeev et al., 2016; Sergeev, 2021). The insects are also common close to irrigated crops and tolerant to a wide range of semi-arid soils and climate conditions. CIT as an ecological plastic species is generally not as fastidiously as other lo- custs and can occupy a wide range of habitats, especially during out- breaks (Monard et al., 2009). It disappears completely if land is plowed since plowing leads to mechanic destruction of egg-pods. The occur- rence of CIT is not only related to food preferences, but also to physical soil properties. Moderate compact sandy soils are more favorable than very loose or compact soils and facilitate oviposition (Toleubayev et al., 2007). Breeding, mating and egg-laying occur in the period between June and September. Since temperature drops during the winter period, the egg-pods lie dormant in diapause. Once moisture is introduced during the warming period in spring, the incubation period starts. Finally, hatching occurs from late April to June, with higher tempera- tures and lower precipitation during this period generally resulting in higher populations. Once ecological conditions are highly suitable over a multiple-year period, a high density of egg-pods and strong survival rates can lead to higher density of adult individuals, potentially leading to phase change, and thus to outbreaks (Sergeev and Van’kova, 2008).
The first study area is the administrative area of Pavlodar oblast, located in the North-East of Kazakhstan (Fig. 1A) with a total area of 125,000 km2. Winters are long (5.5 months) and summers are short (3 months). About 70 to 85% of annual precipitation (200 to 400 mm) falls over the winter period. Characteristically for steppes and semi-desserts, large areas of Kazakhstan are dominated by herbaceous vegetation and sparse shrubs or herbaceous vegetation. Between 1953 and 1964 vast areas of untouched steppe in Northern Kazakhstan were converted to agricultural fields which led to far-reaching consequences and was one of the major land use changes worldwide during the 20th century (Frühauf and Meinel, 2007). Due to the climatic conditions in Kazakhstan, it can take up to 25 years for fallow land to return to its original grassland state (Latchininsky, 2013). After the break down of the USSR in 1991, formerly cultivated land was abandoned, since Kazakhstan lost its role of grain producer for the USSR (Monard et al., 2009) and areas for cereal production decreased from about 25 to 12 million ha (Toleubayev et al., 2007). Those fallow lands became perfect habitats for CIT and have led to a population increase starting in 1996 and leading to the great plague in 1998–2000 (Toleubayev et al., 2007).
2.2. The Moroccan locust and Turkistan oblast
The Moroccan locust occurs in many parts of the Mediterranean and Central Asia. Within the steppe, DMA has rather specific requirements for suitable breeding habitats. They prefer habitats located in elevated regions and foothills (Kokanova, 2017; Latchininsky, 2013, 1998; Monard et al., 2009). In such an environment, hard and dry soils with a high clay content are preferred for egg-laying (Latchininsky, 1998; Uvarov, 1957). Especially areas with a mosaic of steppe vegetation and dry bare soil are preferred, because vegetation clumps protect the egg- pods with shade and provide food for nymphs after hatching (Baldac- chino et al., 2012; Monard et al., 2009; Uvarov, 1957). Such mosaics are often found in overgrazed fields, which form threatening breeding hotspots for DMA (Latchininsky, 1998; Monard et al., 2009; Uvarov, 1957; Zhang et al., 2019). Comparable to the Italian locust disturbed soils (i.e. regularly plowed soil in active agricultural fields) are highly unsuitable for DMA’s breeding, because the egg-pods are destroyed there (Latchininsky, 1998; Monard et al., 2009). Areas that are relatively wet or moist, highly vegetated or have no vegetation at all are rather
unsuitable habitats for DMA (Baldacchino et al., 2012; Latchininsky, 1998). In terms of climatological conditions, DMA occurs in regions that receive 300–500 mm of yearly precipitation (Latchininsky, 2013; Monard et al., 2009) and spring precipitation of approximately 100 mm (Kokanova, 2017; Uvarov, 1957). The mean annual temperature in their breeding habitats is around 16 ◦ C (Kokanova, 2017). Although DMA was considered as one of the most dangerous agricultural pests in the Med- iterranean and Central Asia, the species’ population has decreased during the last century, especially due to industrial, agricultural and urban developments (Latchininsky, 1998). Land cultivation has a negative impact on DMA breeding habitats and many populations have disappeared because of intensive agricultural developments (Monard et al., 2009). However, in Central Asia the danger is still serious. New agricultural development of formerly virgin dry steppes in Azerbaijan, Turkmenistan, Uzbekistan and Kazakhstan resulted in the vicinity of DMA breeding areas and newly-grown crops, which severely increased the risk of crop damage caused by DMA (Monard et al., 2009). Same as CIT, the DMA is an univoltine species (one generation per year), with winter egg diapause. After winter diapause, egg hatching occurs from February to April.
The second study area is the administrative area of Turkistan oblast, located in the South of Kazakhstan (Fig. 1B) and a total area of 117,000 km2. Turkistan oblast is characterized by a semi-arid climate and con- sists mainly of sparsely vegetated grass-, shrub- and croplands. The area has a high range of altitudes, with 120 m of elevation in the lower areas and 3800 m in the mountainous regions in the south-east. Annual pre- cipitation usually ranges from 100 to 500 mm, with more rainfall especially at higher altitudes and during the winter period. The region serves as a suitable habitat for DMA because of the many semi-arid dry grass- and shrublands. Infestations have occurred regularly, especially with relatively hot and dry spring seasons (Latchininsky, 1998).
2.3. The desert locust and Awash river basin
The desert locust is the most dangerous of all migratory pest species in the world (Cressman, 2016). In solitarious phase, desert locust are found in deserts of North Africa, the Middle East and Southwest Asia covering approx.16 Mio km2 of so-called recession area (Cressman, 2016). Within these regions, there are summer and winter-spring breeding areas. Gregarization of desert locust highly depends on spo- radic and unusual heavy rains in the recession area. On the contrary to CIT and DMA, the desert locust does not have a diapause during a cold season and several successive generations can follow one after another when ecological conditions are optimal.
The third selected study area is the Awash river basin (ARB) which extends over its riparian countries Ethiopia, Djibouti, and Somalia with a size of approx. 108,000 km2. In general, the climate in ARB is closely linked to elevation (Bretzler et al., 2011). The rainfall distribution is bimodal in the middle and lower basin and unimodal in the upper basin. The mean annual rainfall is 850 mm over the western part and 465 mm over the eastern part of the basin. Annual rainfall is related to Inter- tropical Convergence Zone (ITCZ) and surface temperature variation over the Indian Ocean and is therefore highly variable resulting in extreme events such as floods or droughts (Dessu and Melesse, 2012; Edossa et al., 2010). The ARB is located within recession area of desert locust and areas of primary breeding can be found here. In 2019, eight tropical cyclones developed over the Indian Ocean resulting in heavy rains over the ARB, which led to suitable conditions for desert locust breeding (Salih et al., 2020).
3. Materials and methods
In this section, we introduce the methodological concept, used data and justification at the background of each species and their preferable conditions. The approach is based on three main steps. First, based on literature review, environmental conditions and corresponding geo- spatial datasets essential for selected locust species breeding suitability were identified. Second, we apply ENM using climate, static edaphic and vegetation variables to generate the distribution of ecological niche for each species. ENM is usually conducted on a larger scale using climate data with a spatial resolution of 1 km or coarser. In such modelling ef- forts, small-scale spatial details which can be quite heterogeneous are not considered. Therefore, in a third step, we fuse the ENM results and additional variables representing higher spatial resolution and recent land surface conditions within an HSI model to gain higher spatial detail and addressing current landscape heterogeneity.
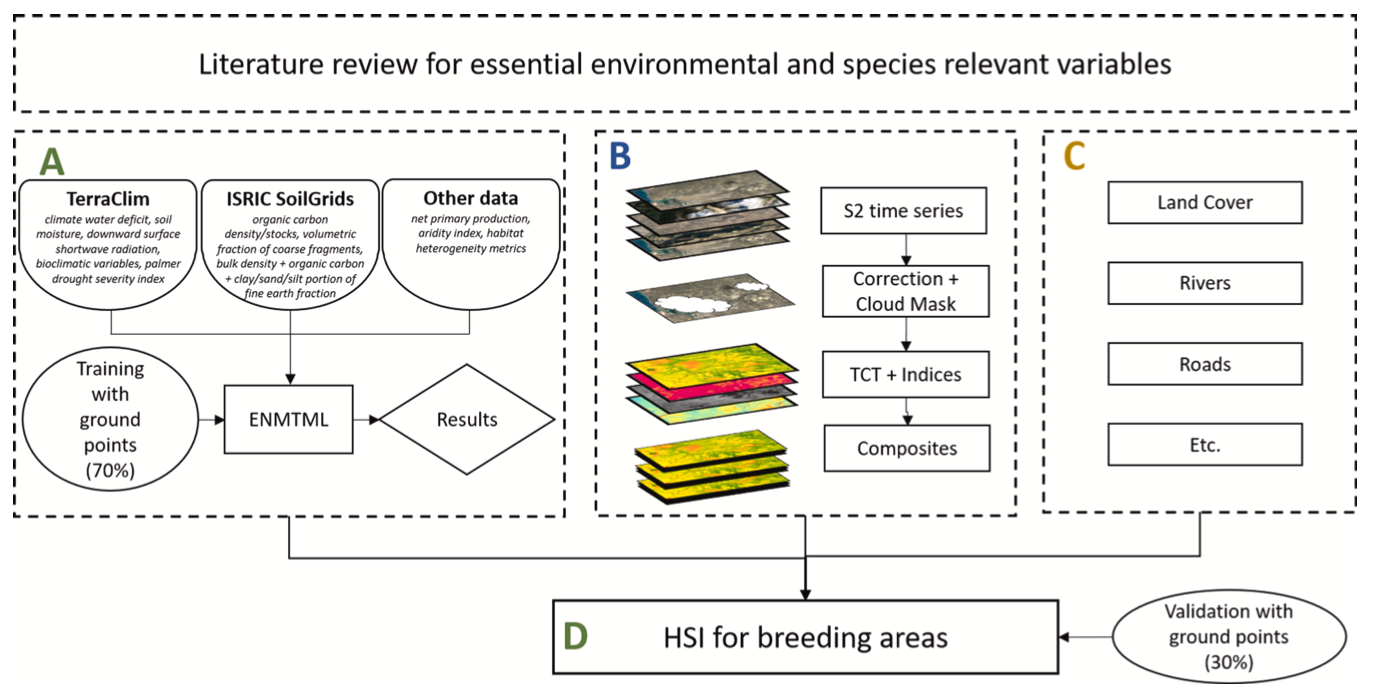
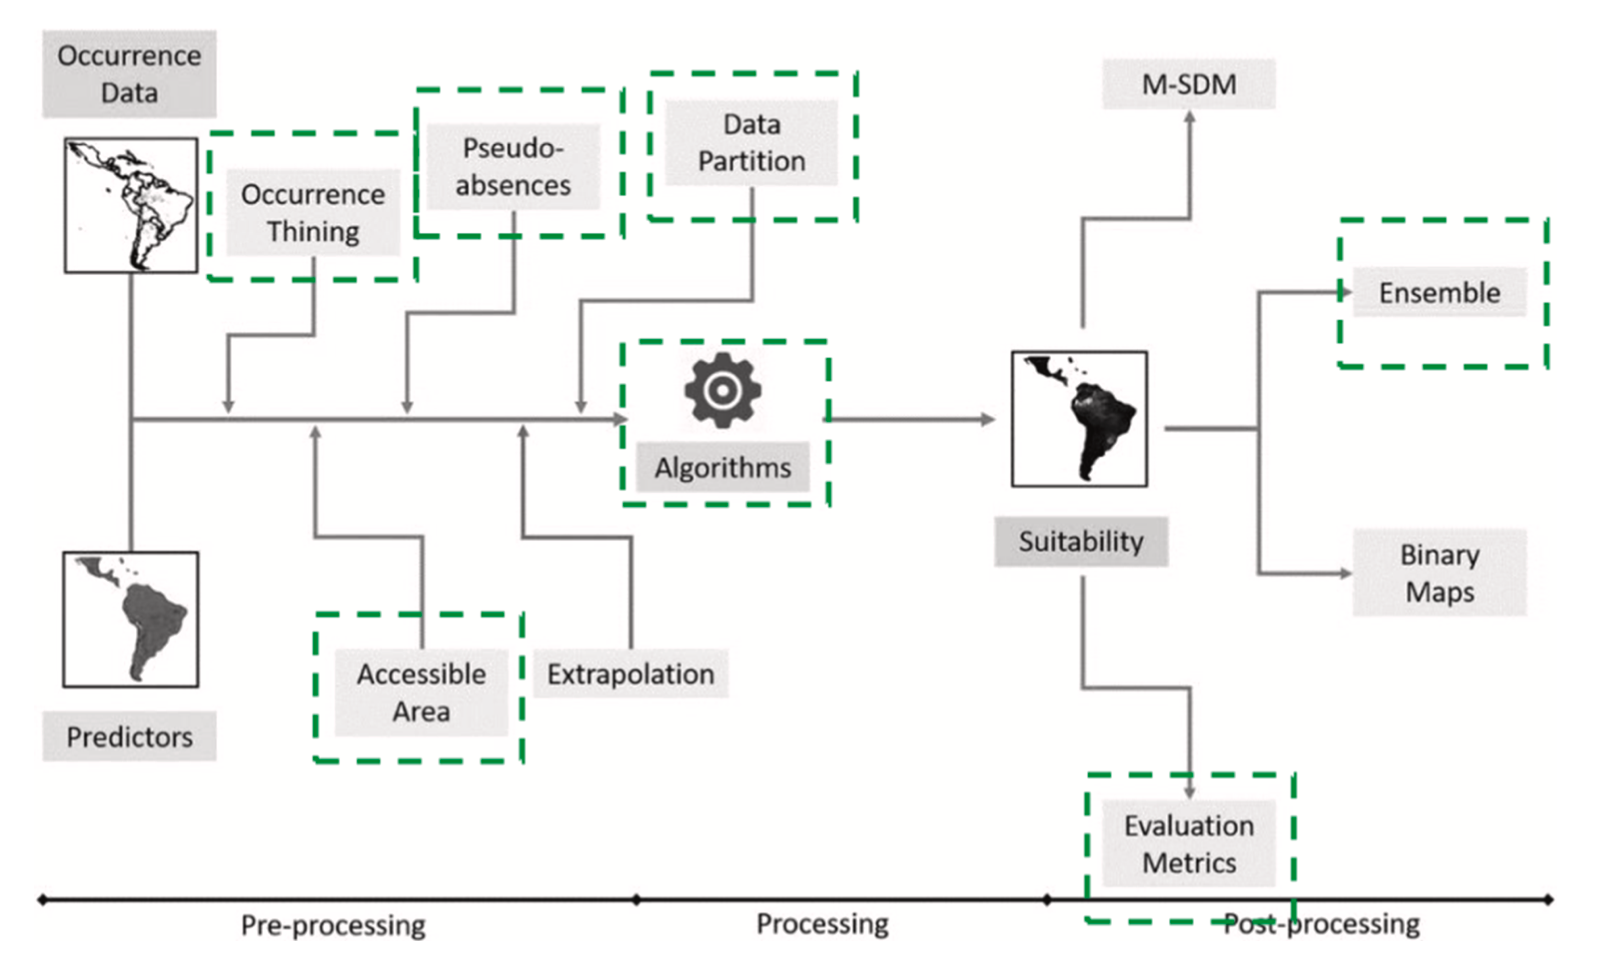
The HSI is a methodological approach to model environmental preferences or limitations for organisms and is an estimator of habitat support (Walz et al., 2015). HSI models were developed by the United States Fish and Wildlife Service in 1981 (Wakeley, 1988) as a cost- effective, powerful and dynamic management tool (Zajac et al., 2015). Literature reviews, expert knowledge and field data can be used to measure different indices for habitat variables, which are then ranked in a HSI model. After Warren et al. (2016) expert knowledge based models perform similarly to empirical models and can be optimized with input of field data to improve their predictive power. The identification of key variables is the most crucial element in HSI modeling (Hirzel and Le Lay, 2008). A schematic overview of the entire workflow including relation of different datasets and models is presented in Fig. 2.
3.1. Datasets and variables for ecological niche and habitat suitability index models
3.1.1. TerraClimate
Climate data includes fundamental descriptors for almost every species’ niche. A commonly used dataset for species modeling is WorldClim (Kimathi et al., 2020; Malakhov and Zlatanov, 2020), that comes with averaged monthly information based on long term data between 1970 and 2000 (Fick and Hijmans, 2017). In this study, we decided to utilize TerraClimate (Abatzoglou et al., 2018) dataset to ac- count for the more recent time period at a spatial resolution of 1/24th of a degree (approx. 4.6 km at the equator). Besides usual variables such as maximum and minimum temperature, vapor pressure, precipitation accumulation, solar radiation and windspeed, the dataset includes further variables such as reference evapotranspiration (ASCE Penman- Montieth), runoff, actual evapotranspiration, climate water deficit, soil moisture, snow water equivalent, Palmer Drought Severity Index, and vapor pressure deficit. We calculated the bioclimatic variables (bio2, bio3, bio4, bio7, bio15) using the processing methodology of the WorldClim dataset and the TerraClimate input variables for the time between 2001 and 2019 within the Google Earth Engine (GEE) appli- cation (Gorelick et al., 2017). The main reasons to utilize TerraClimate were the availability of consistent soil moisture data and more recent data in general, which allowed considering an eventual change in climate variables over the last two decades for mapping an up-to-date breeding habitat.
3.1.2. Additional static datasets
While soil moisture information is retrieved via the TerraClimate dataset, several static soil properties have to be considered. Therefore, variables from SoilGrids 2.0 dataset, which is provided by the Interna- tional Soil Reference and Information Centre (ISRIC), were included. The ISRIC SoilGrids 2.0 provides information on six standard depths (up to 2 m) with a spatial resolution of 250 m for soil type, density, and other soil properties (Poggio et al., 2021).
Additionally, we included seasonal Net Primary Productivity (NPP) product to benefit the ENM (Leita ̃o and Santos, 2019). The MODIS-NPP dataset for 2001–2019 is available at 500 m spatial and 8-day temporal resolution and was aggregated and processed into four seasonal com- posites (Jan-Mar, Apr-Jun, Jul-Sep, Oct-Dec).
Furthermore, we included a landscape texture/heterogeneity dataset (Tuanmu and Jetz, 2015). It is calculated as an average over the period of 2001 until 2005, using 30 m Enhanced Vegetation Index (EVI) input data at a spatial resolution of 1 km.
3.1.3. Water accumulation layer
This layer is based on topographic features and was created by detecting small scale runoff areas, that include seasonal watercourses, which are also known as Wadis. The Wadis become suitable for desert locust breeding when a sufficient amount of rainwater accumulates (Lazar et al., 2015). The processing was based on the Python package pysheds (Bartos, 2020), which enables deriving flow accumulation areas from DEMs (ALOS World 3D − 30 m (AW3D30), (Takaku et al., 2020)).
3.1.4. Sentinel-2 multi-spectral data
The primary dataset that was used to derive actual land surface conditions was optical satellite imagery from Sentinel-2A and -2B. Sentinel-2 images were selected covering the entire study areas of Pavlodar oblast (in total 24 Sentinel-2 tiles), Turkistan oblast (in total 24 Sentinel-2 tiles) and ARB (in total 28 Sentinel-2 tiles) for the years 2017 to 2020. The Sentinel-2 raw data was downloaded and corrected for atmospheric effects with sen2cor software (Pflug et al., 2020) and cloud masking was conducted with the Fmask algorithm (Zhu et al., 2015).
Images with a cloud cover larger than 50% were excluded from the analysis. For all three regions, a total of 4,946 single images (6.76 TB) was downloaded and pre-processed for further analyses. Top of Atmo- sphere (TOA) reflectance was converted to Bottom of Atmosphere (BOA) reflectance. Additionally, an automatic classification included several classes (water, clouds, shadow, ice, no data). Based on BOA data, Tas- seled Cap Brightness (TCB), Greenness (TCG) and Wetness (TCW), as well as the Perpendicular Vegetation Index (PVI) which required a regional definition of soil line (Jensen, 2008), was derived. Since, the application of NDVI in semi-arid regions comes along with restrictions and saturation effects (Cherlet et al., 1991; Despland et al., 2004; Pekel et al., 2011), we used PVI as an alternative. The PVI uses the perpen- dicular distance to the soil line as an indicator of plant development while considering noise caused by soil (Jensen, 2008). Soil properties influence the radiometric response of canopies or vegetation detected by indices since the soil is the last background. Especially for sparsely vegetated areas, which are typical habitats of several locust species in steppe or semi desert, a vegetation index considering the influence of soil is advantageous (Baret et al., 1993).
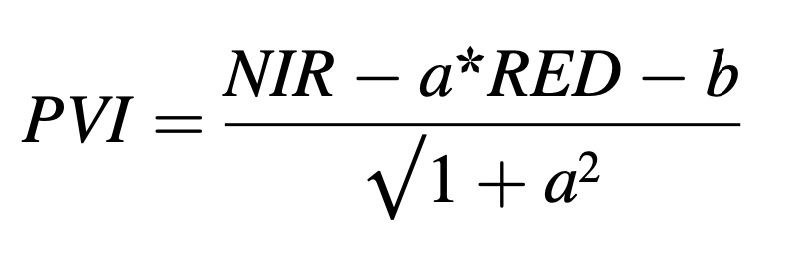
with NIR as near infrared reflection, RED as red reflection, a as slope and b as intercept of the soil line. The soil line concept builds on a linear relationship between red and near infrared reflectance of bare soil and aims to remove most of the effects of soil reflectance for vegetation applications (Baret et al., 1993). The input of this regression is soil reflectance, which is extracted from several parts of bare soil samples within the respective study area as soil reflectance varies from region to region mainly depending on the soil type. Despite all efforts to deter- mine a global soil line, it is advised to delineate study site-specific pa- rameters. Therefore, bare soil samples were manually extracted for each study region to account for their specific soil conditions.
3.1.5. Pre-processing for spatial and temporal aggregation
Since most used datasets are characterized by different spatial and temporal resolution, pre-processing steps aiming spatial and temporal aggregation were necessary. The datasets which are used for ENM require identical spatial extent and resolution (Fig. 2A, (Andrade et al., 2020)). Here, the dataset with the coarsest pixel is taken as reference and all other datasets were upscaled by the means of bilinear interpo- lation approach. Since all dataset used for the ENM are available on global scale, a subset for each study domain was possible. Furthermore, the temporal frequency of all datasets had to be considered. Here, all datasets with higher temporal frequency were aggregated to monthly, seasonal and annual composites (e.g. bio2, bio3, bio4, bio7, bio15). The time-series analysis and pre-processing of Sentinel-2 data is described in Section 3.1.4. In regards to spatial resolution within the HSI model, the original Sentinel-2 pixel size and projection are maintained.
3.1.6. Reference data
Reference data for CIT and DMA breeding locations were acquired in field surveys by regional authorities and provided within the Locust-Tec project for the years 2016–2020. In this study, we consider only location of detected early instar hoppers which mirror successful egg incubation and nymph hatching. In total, 2,985 locations of DMA and 671 locations for CIT were registered by local locust monitoring offices. Besides co- ordinates, the offices usually record different quantitative and qualita- tive parameters. However, for this study only geolocations of early hopper stages were used as points of occurrence.
For desert locust, we used free accessible data published by FAO in the Locust Hub (FAO, 2021b). Here, only breeding locations as well as sightings of early nymph instar were selected for the entire available time period (1985–2020) resulting in a total of 238 occurrence points within ARB and 3,617 for the larger domain of East Africa and the Middle East. Symmons and Cressman (2001) state, that the first four instar levels of desert locust hopper development have a duration of approx. six to seven days. Depending on the weather conditions and the vegetation cover, the daily displacement distances of desert locust hoppers during the first instar vary between 25 and 100 m (Symmons and Cressman, 2001). Because of the low displacement distance during this early phase of locust development, the underlying assumption is that the actual location of hatching was in the close surrounding (Ellenburg et al., 2021). The combination of early instar hopper sightings and actual breeding locations is a reasonable method to in- crease the number of observations for further training and validation. The reference data for each species were then randomly split for training the ENM (70%), and for validation (30%). Pseudo-absence points were generated within ENM process (Section 3.2).
3.2. Ecological niche modelling
According to (Peterson, 2006), environmental (or ecological) niche modelling is the characterization of the distribution of a species in ecological space, which can be used to determine the potential distri- bution of a species in geographic space. In this context, known occur- rences of a species can be related to landscape features and climatic conditions to predict unknown occurrences. Generally, the environ- mental niche of a species is considered to consist of three components: abiotic conditions (e.g. temperature, humidity, soil type), biotic condi- tions (e.g. species interactions, predation, invasion), and accessibility which describes non-biotic conditions limiting the actual dispersion of a species within its potential range (Peterson, 2006). For this study, the R software package ENMTML was used to construct the ENMs for three species of interest (Fig. 3). The ENMTML package considers a wide va- riety of parameters and modelling algorithms that have been identified as highly influential to the process of ENM by leading scientists in the field (Andrade et al., 2020). In fact, choosing different model algorithms has been shown to have a minor effect on model outcome than adjusting assumptions and their related parameters such as pseudo-absence se- lection (Senay et al., 2013). The package includes a selection of up to 13 algorithms for the correlation of input variables to presence and pseudo- absence records (e.g. Boosted Regression Trees, Domain, Generalized Additive Models, Bayesian Gaussian Process, Generalized Linear Models, Maximum Likelihood, Maximum Entropy default, Maximum Entropy simple, Random Forest, Support Vector Machine). In case collinearity reduction methods are chosen, corresponding variables are removed with a high degree of collinearity. The selected collinearity reduction approach was the widely used Variance Inflation Factor (VIF). Second, using the provided occurrence data, also called ‘presence’ records, the input variables were extracted at the locations of the pres- ence points. The occurrence points were ‘thinned’, by removing points which occur within a specified distance to one another to reduce spatial autocorrelation effects (Aiello-Lammens et al., 2015). In order to further mitigate the effects of spatial auto-correlation, a spatial portioning method was chosen for model training. This ensures that training and validation points are not located in immediate vicinity. The method of generating pseudo-absence points was a random selection outside a geographic buffer of 10 km. The final model output is based on an ensemble of all available and applicable algorithms as it usually pro- vides the best performance compared to single approaches. The weighted mean (W-MEAN) was used as a model ensemble method, which incorporated the True Skill Statistic (TSS) measure of model performance as weights.
3.3. Habitat suitability index
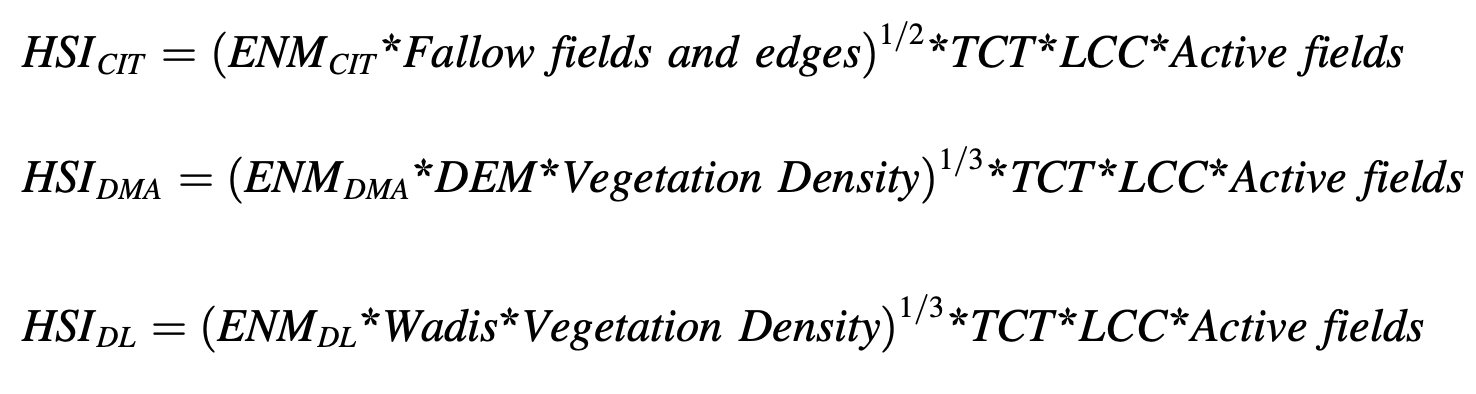
HSI models are a quantitative approach to describe the habitat re- quirements of a species on a continuous scale from 0 (unsuitable) to 1 (suitable) (Wakeley, 1988). For the implemented HSI model, selected variables are aggregated using an additive priority function extended by the multiplication with eliminating factors and was based on the approach presented by (Ahmadi-Nedushan et al., 2006; Oldham et al., 2000):
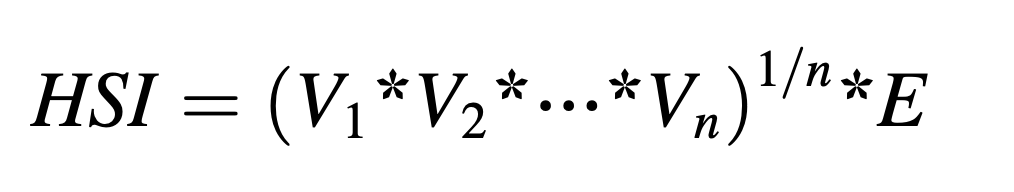
where HSI is the habitat suitability index score scaled from 0 to 1, V is an input variable scaled from 0.01 to 1, n is the total number of input variables and E represents the excluding factors, which are always determined at either 0 or 1. The excluding factors (E) were incorporated by setting several of the input variables to 0 (which always results in an HSI of 0). Specifically, excluding factors are areas covered by permanent water and imperviousness or for some species dense vegetation (e.g. forest). Furthermore, since we aim to derive habitat suitability for breeding conditions active agricultural practice is used as excluding factor because egg-pods are mechanically destroyed if the land is plowed. The final HSI model including ENM results and species-specific variables for three species of interest are described as following equations:
Predicting suitable breeding areas for different locust species – A multi-scale approach accounting for environmental conditions and current land cover situation
4. Results
4.1. Ecological niche and habitat suitability index for breeding sites
The results of the ENM and HSI models for the CIT, DMA and desert locust are presented in Figs. 4–6. The breeding suitability of HSI model was calculated for the year 2019. For a better interpretation, the continuous HSI values can be ranked into discreet categories. Generally, the ranking is objective and varies from source to source (Wakeley, 1988; Walz et al., 2015). In following, we use six categories for breeding and egg-pod surviving suitability: not suitable (0), very low suitability (0.01–0.20), low suitability (0.21–0.40), medium suitability (0.41–0.60), high suitability (0.61–0.80) and very high suitability (0.81–1).
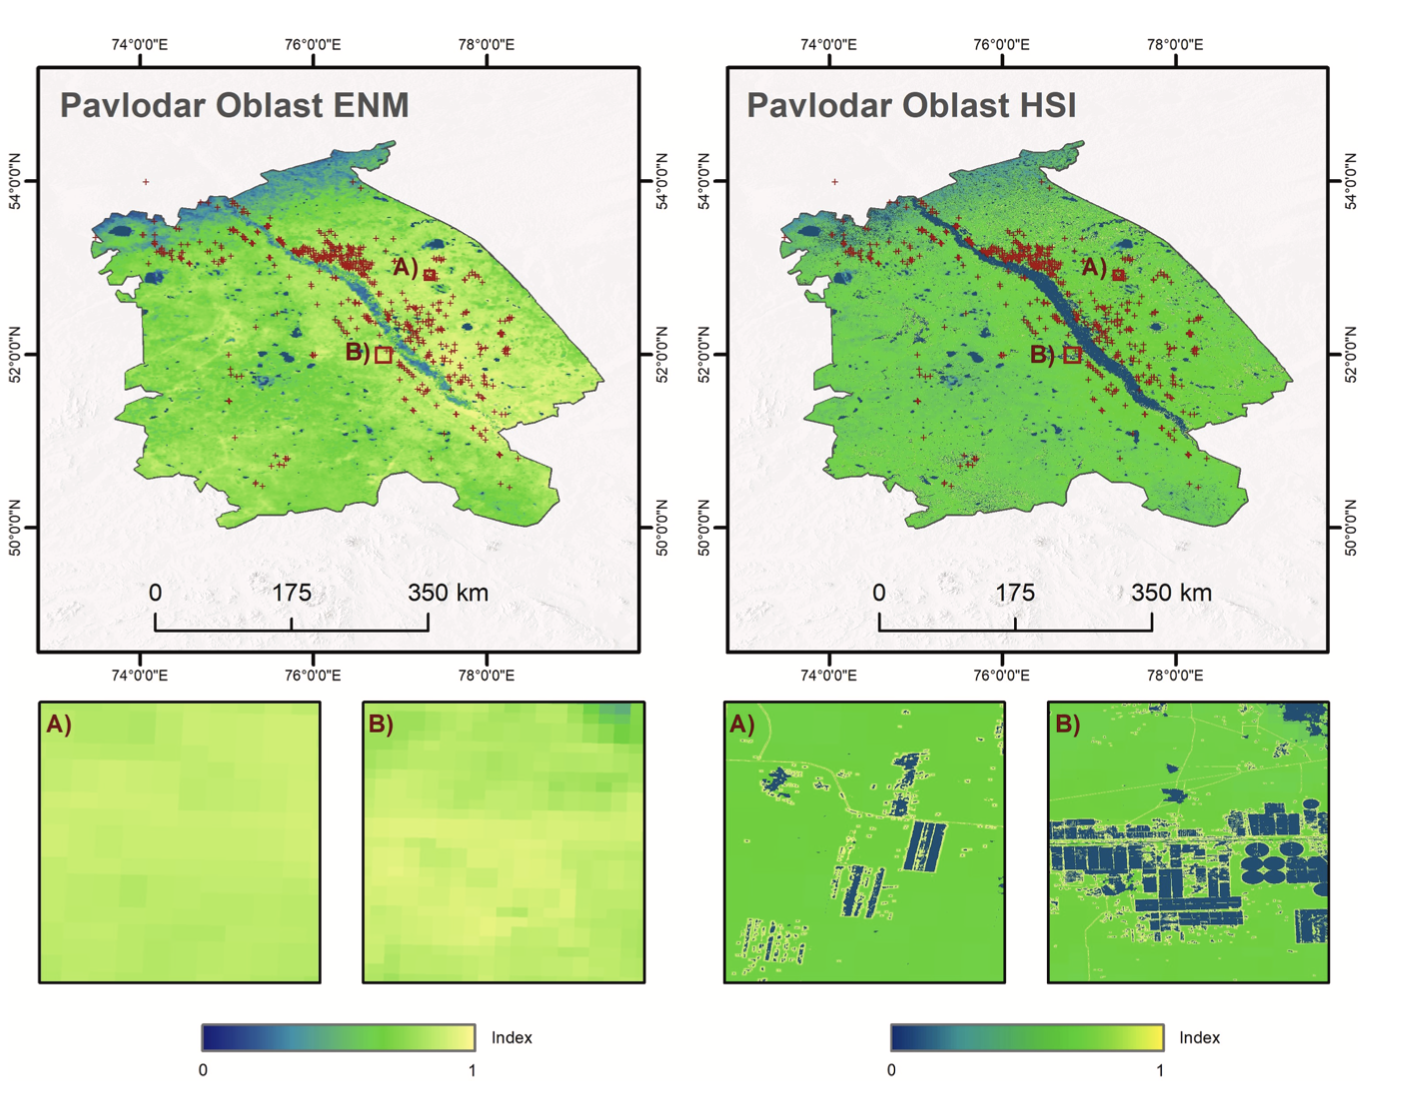
4.1.1. Italian locust
Due to climatic condition and wide ecological tolerance of the CIT, the results of ENM are quite homogenous at high suitability level (Fig. 4). Therefore, the advantage of additional variables and analyze of actual vegetation condition and land management activity is clearly visible within the HSI output. Because CIT is known to prefer vegetation growing on fallow fields and edges of roads and fields, the high- resolution Sentinel-2 reveals higher detail and increases the breeding suitability in those areas. The results for CIT indicate that areas not suitable for breeding and egg survival are marked by the Irtysh River and flood plains characterized by dense vegetation, as well as detected active fields, which are dominant in the northern part of Pavlodar oblast. Fig. 4 demonstrates that wide areas of suitable climate and soil conditions can be further discriminated according to actual land use and land cover conditions. In contrast to ENM, the areas with high probability for growing sagebush/wormwood are characterized by the highest HSI, whereas ploughed land as well as wetlands are characterized by the lowest HSI. High HSI between approximetly 0.65 and 0.75 indicate natural steppe.
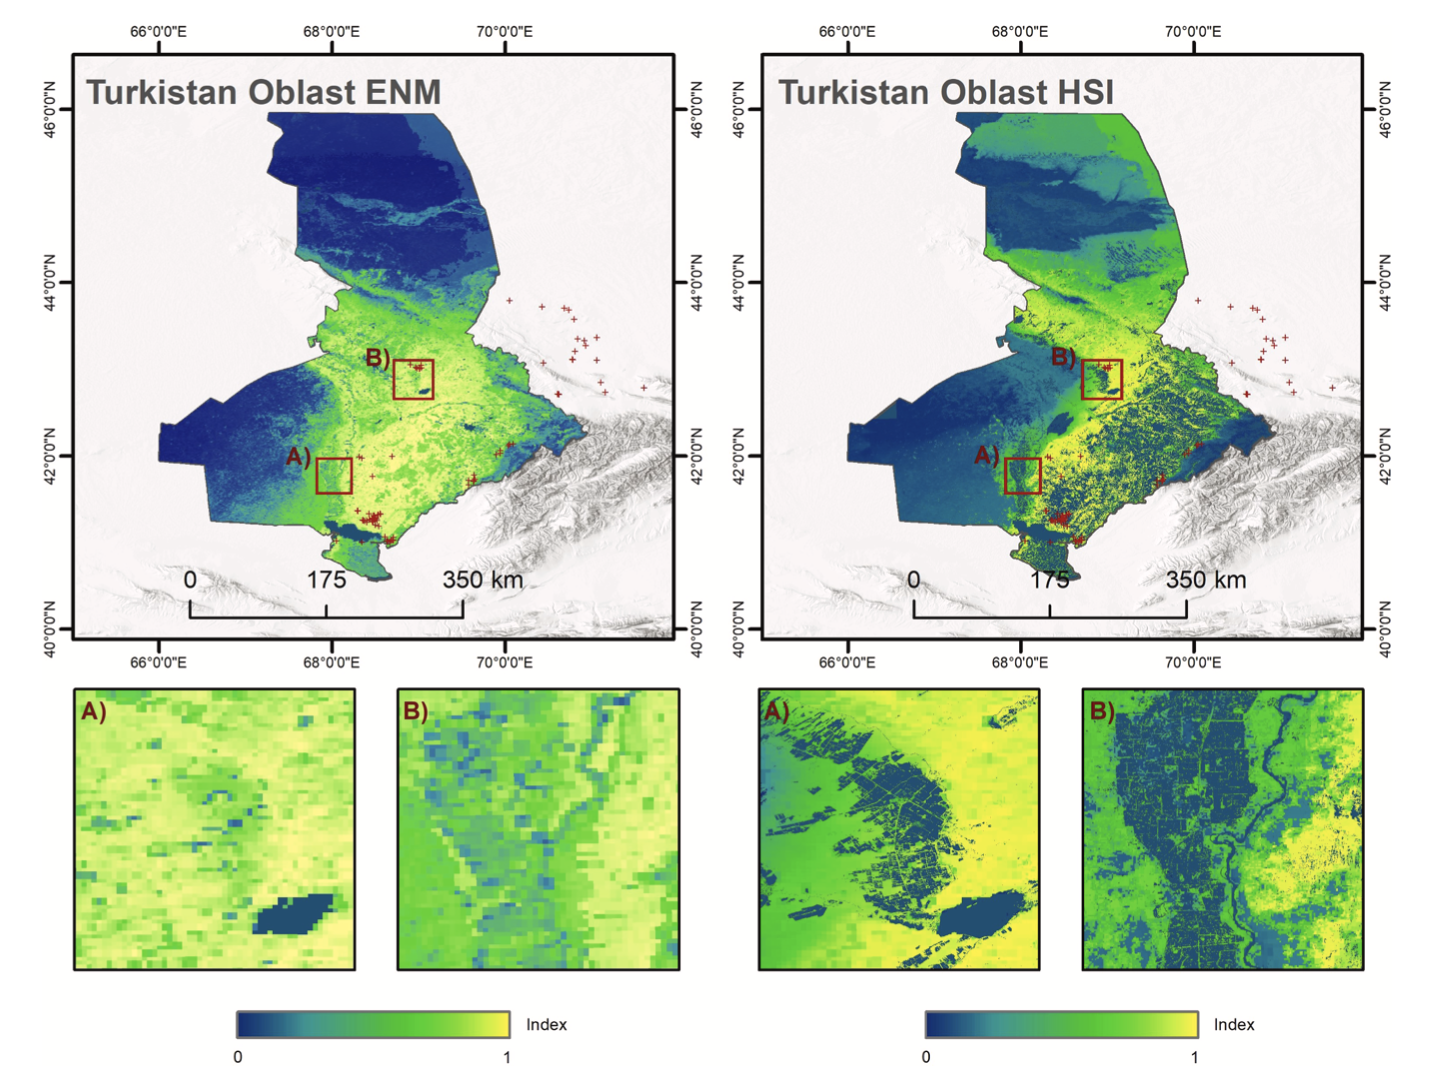
4.1.2. Moroccan locust
The ENM and HSI results for DMA in Turkistan oblast show a clear distinction in highly unsuitable and highly suitable breeding areas (Fig. 5). The South-West and North of the region reveal highly unsuit- able breeding areas due to arid conditions and the absence of vegetation. Hilly areas with steppe vegetation show the most suitable conditions and ploughed land and bare areas are characterized by lower index. The difference between ENM and HSI can be seen West and East of Syrdarya river and Koksaray reservoir. Large areas with suitable climate, soil and elevation in the South-East become unsuitable for breeding due to active agriculture. Fig. 5 shows the spatial upgrade between ENM and HSI within the study area. Similar to CIT in Pavlodar oblast, active land management, lakes and rivers are excluded from areas of possible breeding. Furthermore, including high-resolution DEM within HSI model accounts better for changes in elevation as DMA is sensitive to altitude and has a narrow range.
4.1.3. Desert locust
According to ENM output, most of the ARB is highly suitable for desert locust breeding. Only in the South-West region, a narrow strip in the West and South show unfavorable conditions. These regions receive higher precipitation and are dominated by agricultural land and forest (Fig. 6). Higher suitability values for river reaches, wadis and sinks underline that a certain vegetation density is required for breeding and feeding. Areas with no vegetation or highly dense vegetation are char- acterized by a lower suitability index compared to ENM outcome. Fig. 6 highlights this improvement and introduced heterogeneity.
4.2. Validation
The main validation metric for this study was the Area Under the Curve (AUC) of the Receiver Operating Characteristic (ROC) (Fielding and Bell, 1997; Hanley and McNeil, 1982). ROC-AUC is a common assessment method for ENM and HSI results, as it does not rely on a classified, dichotomous output such as presence/non-presence (Fielding and Bell, 1997). It is a ‘threshold-independent’ metric and the perfor- mance of a model is estimated by creating a plot of all sensitivity values (the fraction of true positive outcomes) against the corresponding 1- specificity (the fraction of false positive outcomes) (Fielding and Bell, 1997). The AUC ranges from 0.5 to 1.0 and is often used as a single model performance measurement, because it represents the probability if a presence and an absence location are randomly modelled. The presence location will have a higher predicted value than the absence location (Raes and ter Steege, 2007). Accordingly, an AUC score of 0.5 indicates that the tested model has no predictive capabilities, while a model with a score of 1.0 has a 100% chance of predicting higher values at presence locations than at absence locations (Raes and ter Steege, 2007). However, the AUC does not indicate to which extent the pre- dicted outcomes are higher in value than the absences. In addition, when using pseudo-absences the maximum value the AUC can reach in prac- tice is dependent on the true distribution of the species in relation to the selected extent of the area of interest (Barbet-Massin et al., 2012; Raes and ter Steege, 2007). Therefore, it is not possible to set a fixed threshold as measure for an accurate model according to its performance as esti- mated through the AUC. In order to get a robust estimation of the AUC for each output of the ENM and HSI, we selected random background points as so-called pseudo-absences, while the validation occurrence locations were used as presence locations (30% split of all occurrence points within each ROI). First, for the calculation of the AUC for each study region, a pre-selection of 20,000 random background points was made (NA values excluded). In a second step, 10,000 points were selected from this pool, in order to obtain a representative distribution of non-NA background values. Finally, using the package pROC in R soft- ware, stratified bootstrapping was applied, in which a random stratified fraction of presence and background points were selected 5,000 times for the AUC calculation, after which the mean AUC value returned, as well as a 95% confidence interval (Robin et al., 2011).
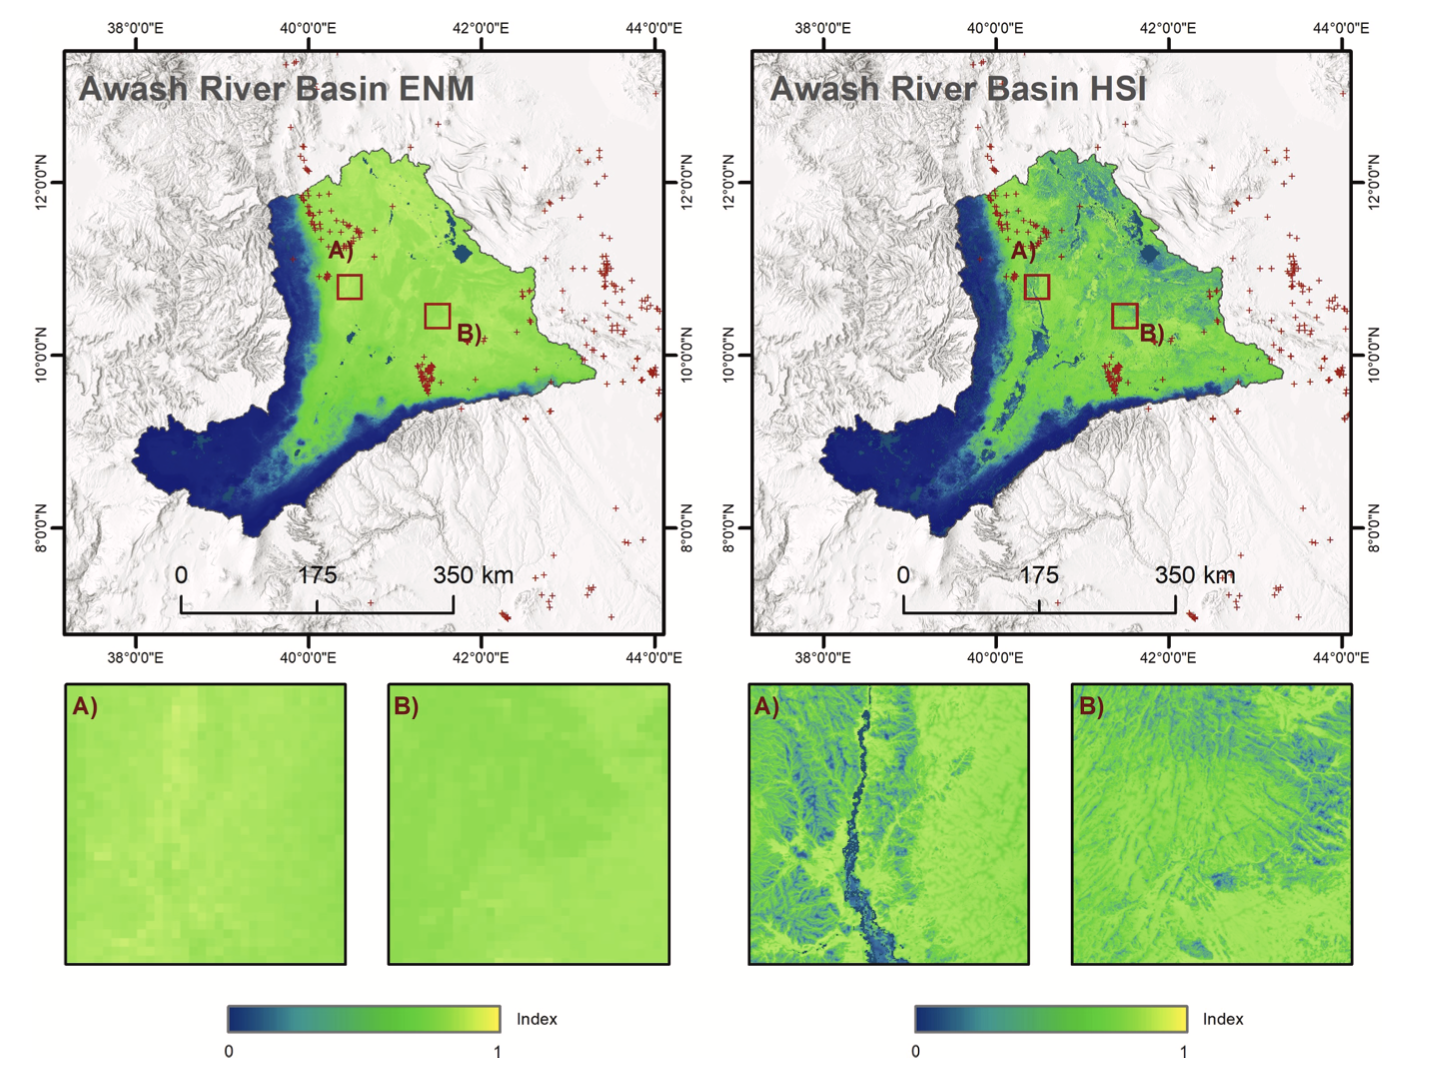
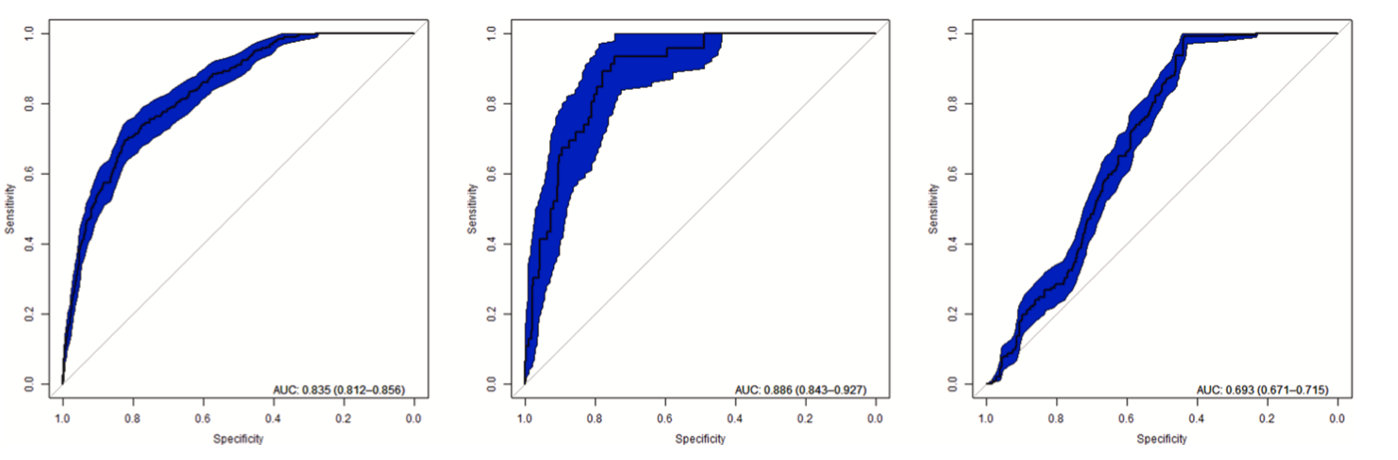
Fig. 7 presents the AUC results for CIT, DMA and desert locust based on ground truth data that was independent of the training dataset (Section 3.1.5). The Y-axis represents the sensitivity, or the fraction of true positives, while the X-axis represents the specificity, or the true negative rate. It is important to note that the AUC cannot be compared across studies with different modelling extents and constraints, as the AUC is sensitive to the set-up of the sampling design (Barbet-Massin et al., 2012; Raes and ter Steege, 2007). According to computed AUC values, the prediction of the ENM model for CIT was 0.835, for DMA 0.886 and for desert locust 0.693. The reason for the lower performance within ARB can be found in the fact that the majority of the basin is quite homogenous and only a few validation occurrence points were avail- able. The AUC result for entire East Africa and the Middle East domain was 0.951 (Supplementary Material, Fig. 1). The lower AUC for smaller ARB domain can be explained by the fact that the ARB region is more homogenous and fewer validation points were available (Iturbide et al., 2015). Additionally, the spread of presence points is more homogeneous within smaller AOIs compared to the spread of presence points throughout a large heterogeneous study area. Therefore, a larger spatial extent and heterogeneous area will result in a higher model accuracy (Allouche et al., 2006; Raes and ter Steege, 2007).
The performance for HSI results (Fig. 8) shows different outcomes which can be explained by the occurrence points availability and dis- tribution as well as by the different index ranges within the areas. For CIT, the AUC of HSI output for 2019 was 0.747. Compared to coarse resolution ENM results the prediction performance of suitable breeding sites decreased by 0.088. The AUC for DMA in Turkistan was 0.850 and decreased slightly by 0.037. On the contrary, HSI results for desert locust in ARB are higher with 0.801 and increased by 0.108.
5. Discussion
Ground-based surveillance demands great manpower of trained re- searchers to examine vast recession areas (van Huis et al., 2007). Mil- lions of hectares have to be investigated within a narrow time window of only a few weeks (Latchininsky et al., 2016). Therefore, up-to-date habitat suitability maps with high spatial resolution and detail can contribute to improve the efficiency and focus on relevant suitable breeding areas (Cressman, 2013; Sivanpillai et al., 2009). The ENM represents the niche of species at coarse spatial resolution mirroring mainly climatic and edaphic conditions on a large scale. However, several studies have shown that land management such as grazing (Le Gall et al., 2019) or land plowing (Malakhov and Zlatanov, 2020) play essential role for locust-human linkage. Therefore, we further fused ENM results in a HSI model. This approach provides several advantages and refinements such as adding more species-related parameters (e.g. edges of fields for CIT), mirroring actual land cover by using the latest satellite data at high spatial resolution (e.g. to map abandoned fields or active cultivation) (Latchininsky, 2013). In this study, we modelled a map of breeding and egg incubation suitability for three locust species. Mapping areas suitable for egg incubation and survival at a high level of spatial detail and higher frequency can provide year-to-year alterations and an improved information for locust management. This is of impor- tance for species which breeding area preferences are highly dependent on land management (e.g. CIT and DMA), or sudden soil moisture and vegetation density changes (e.g. desert locust). The presented approach and derived results account for the ecological niche of the species defined by climatic and edaphic conditions but also for species-specific features such as fallow fields, field edges in the case of CIT or Wadis and terrain sinks with moisture accumulation in case of desert locust.
The high HSI AUC for DMA and desert locust shows that the pre- sented approach is capable to perform a selective and accurate distinc- tion in suitable and unsuitable breeding areas at a higher spatial resolution of 10 m. In the study regions for DMA and desert locust, there are limiting factors for their successful breeding such as the presence of deserts, mountains and cultivated areas. Therefore, the HSI is hetero- genic, and artificially generated absence points are distributed equally over suitable and unsuitable areas. On the contrary, the situation in Pavlodar oblast is very homogenous and suitable for CIT breeding. Only wetlands, water bodies and a minor portion of regularly active fields contribute to a low HSI. Furthermore, CIT has a wide range of preferred habitats in general, while DMA has rather niche habitat preferences and its distribution is limited to particular environments (Monard et al., 2009). Therefore, given that these suitable environments can be accu- rately modeled, the habitats of DMA can be easier delineated from un- suitable environments than those of CIT. Artificially generated absence points are distributed across larger suitable areas and the results of AUC are less clear as random points show a higher probability in higher suitable areas. To overcome this and other restrictions related to the fact that only occurrence points are collected, ground truth absence locations are required (Fielding and Bell, 1997; Lobo et al., 2008). In general, both, selectiveness and accuracy are important for practical applications of the presented approach, because it can improve the targeting for surveys as well as for preventive locust chemical pest treatments which might be needed to limit costs and environmental damage. The accuracy depends on the species and environment of the study area. Usually, accuracy assessment for species distribution modeling leads to higher accuracies in more heterogeneous study areas, while in homogeneous areas such as Pavlodar oblast the accuracy is lower. Large study areas with easily distinguishable unsuitable habitats (e.g. high altitudes, water bodies) will lead to higher model accuracies. Nevertheless, statistical accuracy assessments of species distribution models are known to have limitations, especially when presence-only reference data is the only mean for validation (Fielding and Bell, 1997; Lobo et al., 2008). Furthermore, effects of spatial- and temporal auto-correlation likely still influenced the results, despite the split of the observational data and the spatial partitioning strategy used in the modelling process. When split- ting the observational data into training and testing sets, it is assumed these are independent (Bahn and McGill, 2013). However, it is known that the surveyors often revisit sites of which it is known surveys were taken in previous years (Zaniewski et al., 2002). In addition, the sur- veyed areas are also often closer to roads due to their increased accessibility.
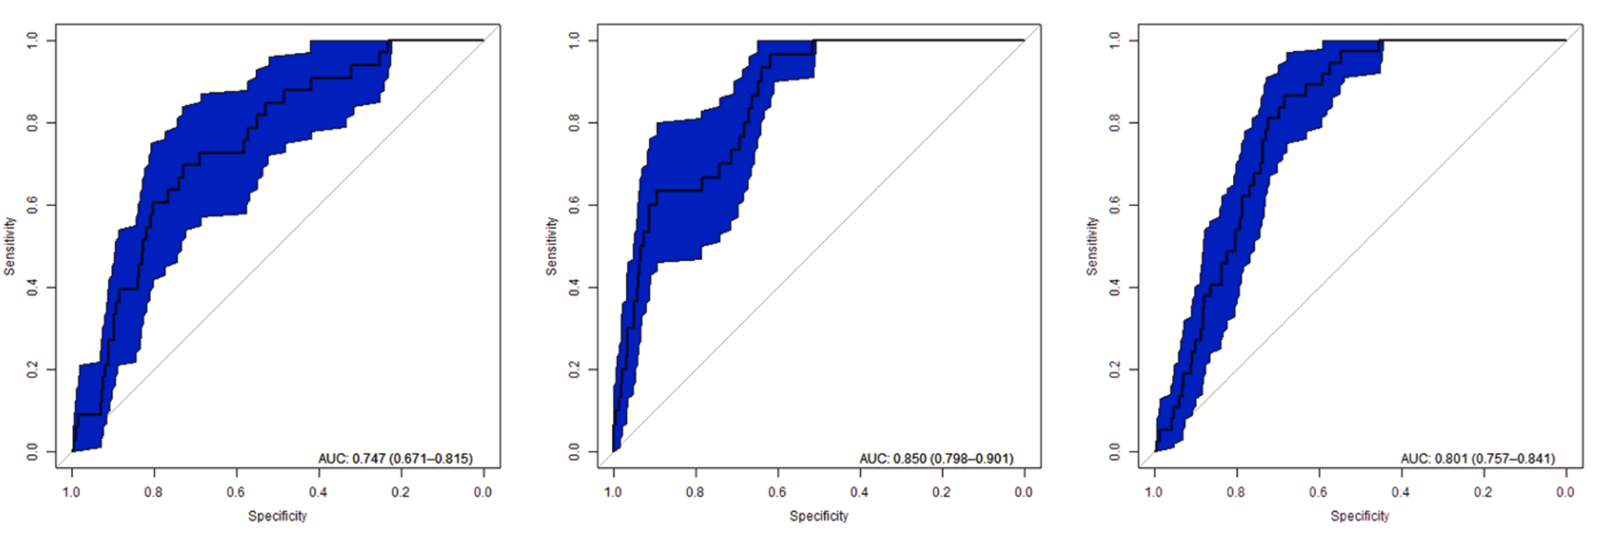
Fig. 8. AUC for HSI results; left) CIT in Pavlodar oblast; middle) DMA in Turkistan oblast; right) desert locust in Awash river basin.
For further research, the availability of more reference data including absence points and more accurate environmental variables will reveal more opportunities to improve modeling with a more data- driven parameter tuning. A species-specific analysis and research of relevant variables and favorable conditions will improve the final re- sults. Future investigation could adapt presented approach on larger scale and combine it with migration paths to assess the connectivity between separated habitats. Furthermore, in the context of global climate change and shifting climate zones (Mahlstein et al., 2013) as well as the alteration in land-use practices, locust habitats are also affected. This can result in more often and more intense outbreaks due to unusual rainfalls (Meynard et al., 2020; Salih et al., 2020; Stone, 2020; Tratalos et al., 2010; Zhang et al., 2019). Changing climate will also have effects on univoltine species such as CIT and DMA (one generation per year) because of the importance of winter egg diapause and weather conditions which detemine the survival as well as timing of hatching. In combination with actual land management (e.g. land plowing and overgrazing) and favourble conditions suitable areas for breeding are changing throughout the time (Malakhov and Zlatanov, 2020). There- fore, monitoring efforts and international colaboration between affected countries as supoorted by FAO (FAO, 2021b, 2021a, 2009) have to be maintained and strengthend.
6. Conclusion
The goal of this research was to explore whether ecological niche modelling (ENM) and a habitat suitability index (HSI) model can be combined to refine results for actual breeding areas of three different locust pests. With the application of ENM as part of HSI, the information value based on climatic and soil preference components defining locust species’ ecological niche are maintained. In addition, up to date land surface parameters, vegetation development and other species relevant environmental parameters were incorporated in the HSI model. More- over, human interaction and actual land surface dynamics play a crucial role for locust outbreaks and influence and define suitable breeding areas. Therefore, modelling based only on climatic and edaphic vari- ables provides only the ecological niche of a species without considering actual changes of the landscape or situation. In this study, we demon- strated a way to account for this issue by implementing different vari- ables derived from Sentinel-2 time-series analysis, which describe the actual state of the land and in this way further narrow suitable breeding areas within an HSI model. The presented approach for mapping egg- pod incubation and breeding suitability was tested for Italian locust in Pavlodar oblast (Kazakhstan), for Moroccan locust in Turkistan oblast (Kazakhstan), and for desert locust in the Awash river basin (Ethiopia, Djibouti, Somalia). Results show high potential to enable a better pri- oritization and spatial focus for field monitoring to improve planning and control outbreaks without a significant loss in accuracy but an improvement in spatial detail:
- – The AUC measure of the HSI maps for 2019 showed good prediction performance of 0.747 for CIT, 0.850 for DMA and 0.801 for desert locust.
- – the areas of “very high breeding suitability” (0.8–1.0) and “high breeding suitability” (0.6–0.8) for Italian locust in Pavlodar oblast were 3.97% (4,970 km2) and 60.71% (75,9122km2), for Moroccan locust in Turkistan oblast 16.20% (18,765 km ) and 7.37% (8,535 km2) and for desert locust in Awash river basin 2.82% (3,045 km2) and 36.79% (39,733 km2).
- – Compared to ENM alone, the area characterized by “very high breeding suitability” and “high breeding suitability” reduced by 22,1% (27,633 km2), 10,68% (12,372 km2) and 22,45% (24,246 km2) respectively.
- – Therefore, presented approach could enable to account for actual land cover and consider where eggs will survive and therefore contribute to prioritize areas for locust management activities from year to year.
Historical and recent locust outbreaks around the world underline the urgent necessity for further improvement of monitoring and pre- diction technics. The potential of remote sensing applications has received a boost over the past few years. Impoved datasets, large his- torical archives and cloud computing opportunities will further contribute to improve locust management to timely assess risks of in- festations and take preventive and more environmentally friendly measures by treating only areas which are actually affected. In this context, it is important to consider all relevenat variables and species- environment-climate-human interaction nexus to better interpret and understand data and results. The innovation of this study is a multi-scale approach which accounts not only for climatic and environmental conditions but also for current vegetation and land management situa- tion. In this way, more explicit information can be used for risk assess- ment and early intervention to reduce monitoring costs, overuse of chemical insectisicides (Malakhov and Zlatanov, 2020) as well as allow spatial prioritization in case of emergency or limited budgets.
Funding
This research has been performed within the Locust-Tec project (http s://www.locust-tec.eoc.dlr.de) funded by BMBF in the framework of CLIENT-II program (https://www.bmbf-client.de/en).
CRediT authorship contribution statement
Igor Klein: Conceptualization, Methodology, Formal analysis, Investigation, Writing – original draft, Writing – review & editing, Visualization, Project administration, Funding acquisition. Sietse van der Woude: Methodology, Formal analysis, Writing – review & editing, Visualization. Frederic Schwarzenbacher: Methodology. Nadiya Muratova: Writing – review & editing. Bart Slagter: .Dmitry Mala- khov: Writing – review & editing. Natascha Oppelt: Writing – review & editing, Supervision. Claudia Kuenzer: Writing – review & editing, Supervision.
Declaration of Competing Interest
The authors declare that they have no known competing financial interests or personal relationships that could have appeared to influence the work reported in this paper.
Acknowledgments
First of all, we would like to pay our gratitude and our respects to V. E. Kambulin (Zhyembayev’s Institute of Plant Protection and Quaran- tine, Almaty) for his life’s work and for sharing his valuable knowledge and experience gained over more than five decades working in the field with different locust species. We would like to thank anonymous re- viewers for their valuable time, attention to detail and provided rec- ommendations to improve this manuscript. We would like to thank Nadiya Muratova, international consultant of FAO for the recommen- dation of Locust-Tec project, Z. Niyazbekov, A. Uspanov, N. Raissova from Zhyembayev’s Institute of Plant Protection and Quarantine and V. I. Pankov from Regional Pavlodar Office for supporting this project and research with their resources, knowledge and help. Furthermore, we would like to thank B. Leutner (DFD-DLR) for setting up Sentinel pre- processing chains, and V. Hueffer (University of Trier) and B. Slagter (Wageningen University) for their support during their student activities within the Locust-Tec project.
Predicting suitable breeding areas for different locust species – A multi-scale approach accounting for environmental conditions and current land cover situation
References
Abatzoglou, J.T., Dobrowski, S.Z., Parks, S.A., Hegewisch, K.C., 2018. TerraClimate, a high-resolution global dataset of monthly climate and climatic water balance from 1958–2015. Sci. Data 5, 170191. https://doi.org/10.1038/sdata.2017.191.
Ahmadi-Nedushan, B., St-Hilaire, A., B ́erub ́e, M., Robichaud, E ́., Thi ́emonge, N., Bob ́ee, B., 2006. A review of statistical methods for the evaluation of aquatic habitat suitability for instream flow assessment. River Res. Appl. 22 (5), 503–523. https:// doi.org/10.1002/rra.918.
Aiello-Lammens, M.E., Boria, R.A., Radosavljevic, A., Vilela, B., Anderson, R.P., 2015. spThin: an R package for spatial thinning of species occurrence records for use in ecological niche models. Ecography 38 (5), 541–545. https://doi.org/10.1111/ ecog.01132.
Allouche, O., Tsoar, A., Kadmon, R., 2006. Assessing the accuracy of species distribution models: prevalence, kappa and the true skill statistic (TSS): Assessing the accuracy of distribution models. J. Appl. Ecol. 43, 1223–1232. https://doi.org/10.1111/j.1365- 2664.2006.01214.x.
Andrade, A.F.A.d., Velazco, S.J.E., De Marco Júnior, P., 2020. ENMTML: An R package for a straightforward construction of complex ecological niche models. Environ. Model. Softw. 125, 104615. https://doi.org/10.1016/j.envsoft.2019.104615.
Arago ́n, P., Coca-Abia, M.M., Llorente, V., Lobo, J.M., 2013. Estimation of climatic favourable areas for locust outbreaks in Spain: integrating species’ presence records and spatial information on outbreaks. J. Appl. Entomol. 137 (8), 610–623. https:// doi.org/10.1111/jen.12022.
Bartos, M., 2020. Pysheds: simple and fast watershed delineation in python. doi: 10.5281/zenodo.382249.
Bahn, V., McGill, B.J., 2013. Testing the predictive performance of distribution models. Oikos 122 (3), 321–331. https://doi.org/10.1111/j.1600-0706.2012.00299.x.
Baldacchino, F., Sciarretta, A., Addante, R., 2012. Evaluating the spatial distribution of Dociostaurus maroccanus egg pods using different sampling designs. Bull. Insectology 65, 223–231.
Barbet-Massin, M., Jiguet, F., Albert, C.H., Thuiller, W., 2012. Selecting pseudo-absences for species distribution models: how, where and how many?: How to use pseudo- absences in niche modelling? Methods Ecol. Evol. 3, 327–338. https://doi.org/ 10.1111/j.2041-210X.2011.00172.x.
Baret, F., Jacquemoud, S., Hanocq, J.F., 1993. The soil line concept in remote sensing. Remote Sens. Rev. 7 (1), 65–82. https://doi.org/10.1080/02757259309532166.
Bretzler, A., Osenbrück, K., Gloaguen, R., Ruprecht, J.S., Kebede, S., Stadler, S., 2011. Groundwater origin and flow dynamics in active rift systems – A multi-isotope approach in the Main Ethiopian Rift. J. Hydrol. 402 (3-4), 274–289. https://doi.org/ 10.1016/j.jhydrol.2011.03.022.
Cherlet, M.R., Gregorio, A.DI., Hielkema, J.U., 1991. Remote-sensing applications for desert-locust monitoring and forecasting. EPPO Bull. 21 (3), 633–642. https://doi. org/10.1111/j.1365-2338.1991.tb01297.x.
Cressman, K., 2016. In: Biological and Environmental Hazards, Risks, and Disasters. Elsevier, pp. 87–105. https://doi.org/10.1016/B978-0-12-394847-2.00006-1.
Cressman, K., 2013. Role of remote sensing in desert locust early warning. J. Appl. Remote Sens. 7 (1), 075098. https://doi.org/10.1117/1.JRS.7.075098.
Despland, E., Rosenberg, J., Simpson, S.J., 2004. Landscape structure and locust swarming: a satellite’s eye view. Ecography 27, 381–391. https://doi.org/10.1111/ j.0906-7590.2004.03779.x.
Dessu, S.B., Melesse, A.M., 2012. Impact and uncertainties of climate change on the hydrology of the Mara River basin, Kenya/Tanzania: MARA RIVER BASIN: CLIMATE CHANGE AND HYDROLOGY. Hydrol. Process. n/a–n/a. https://doi.org/10.1002/ hyp.9434.
Edossa, D.C., Babel, M.S., Das Gupta, A., 2010. Drought Analysis in the Awash River Basin. Ethiopia. Water Resour. Manag. 24 (7), 1441–1460. https://doi.org/10.1007/ s11269-009-9508-0.
Ellenburg, W.L., Mishra, V., Roberts, J.B., Limaye, A.S., Case, J.L., Blankenship, C.B., Cressman, K., 2021. Detecting Desert Locust Breeding Grounds: A Satellite-Assisted Modeling Approach. Remote Sens. 13, 1276. https://doi.org/10.3390/rs13071276.
Escorihuela, M.J., Merlin, O., Stefan, V., Moyano, G., Eweys, O.A., Zribi, M., Kamara, S., Benahi, A.S., Ebbe, M.A.B., Chihrane, J., Ghaout, S., Ciss ́e, S., Diakit ́e, F., Lazar, M., Pellarin, T., Grippa, M., Cressman, K., Piou, C., 2018. SMOS based high resolution soil moisture estimates for desert locust preventive management. Remote Sens. Appl. Soc. Environ. 11, 140–150. https://doi.org/10.1016/j.rsase.2018.06.002.
FAO, 2021. Locust Watch – Locusts in Caucasus and Central Asia. Food and Agriculture Organization of the United Nations (FAO). http://www.fao.org/locusts-cca/en/. FAO, 2021. Locust Hub. Food and Agriculture Organization of the United Nations (FAO). https://locust-hub-hqfao.hub.arcgis.com/.
FAO, 2009. Desert Locust Information Service (DLIS). Food and Agriculture Organization of the United Nations (FAO). http://www.fao.org/ag/locusts/en/archives/archive/index.html.
Fick, S.E., Hijmans, R.J., 2017. WorldClim 2: new 1-km spatial resolution climate surfaces for global land areas. Int. J. Climatol. 37 (12), 4302–4315. https://doi.org/10.1002/joc.5086.
Fielding, A.H., Bell, J.F., 1997. A review of methods for the assessment of prediction
errors in conservation presence/absence models. Environ. Conserv. 24 (1), 38–49. https://doi.org/10.1017/S0376892997000088.
Frühauf, M., Meinel, T., 2007. Vom “Neuland unterm Pflug” zum “Dust-Bowl-Syndrom”: Die ackerbauliche Umgestaltung der südrussisch-kasachischen Steppengebiete. In: Glaser, R. Glaser, R., Kremb, K., (Eds.). Planet Erde – Asien. Asien. Wissenschaftliche Buchgesellschaft, pp. 77–89.
Go ́mez, D., Salvador, P., Sanz, J., Casanova, C., Taratiel, D., Casanova, J.L., 2019. Desert locust detection using Earth observation satellite data in Mauritania. J. Arid Environ. 164, 29–37. https://doi.org/10.1016/j.jaridenv.2019.02.005.
Go ́mez, D., Salvador, P., Sanz, J., Casanova, C., Taratiel, D., Casanova, J.L., 2018. Machine learning approach to locate desert locust breeding areas based on ESA CCI soil moisture. J. Appl. Remote Sens. 12, 1. https://doi.org/10.1117/1. JRS.12.036011.
Gorelick, N., Hancher, M., Dixon, M., Ilyushchenko, S., Thau, D., Moore, R., 2017. Google Earth Engine: Planetary-scale geospatial analysis for everyone. Remote Sens. Environ. 202, 18–27. https://doi.org/10.1016/j.rse.2017.06.031.
Hanley, J.A., McNeil, B.J., 1982. The meaning and use of the area under a receiver operating characteristic (ROC) curve. Radiology 143 (1), 29–36. https://doi.org/ 10.1148/radiology.143.1.7063747.
Hirzel, A.H., Le Lay, G., 2008. Habitat suitability modelling and niche theory. J. Appl. Ecol. 45, 1372–1381. https://doi.org/10.1111/j.1365-2664.2008.01524.x.
Hunter, D.M., 2004. Advances in the control of locusts (Orthoptera: Acrididae) in eastern Australia: from crop protection to preventive control. Aust. J. Entomol. 43 (3), 293–303. https://doi.org/10.1111/j.1326-6756.2004.00433.x.
Hunter, D.M., McCulloch, L., Spurgin, P.A., 2008. Aerial detection of nymphal bands of the Australian plague locust (Chortoicetes terminifera (Walker)) (Orthoptera: Acrididae). Crop Prot. 27 (1), 118–123. https://doi.org/10.1016/j. cropro.2007.04.016.
Iturbide, M., Bedia, J., Herrera, S., del Hierro, O., Pinto, M., Guti ́errez, J.M., 2015. A framework for species distribution modelling with improved pseudo-absence generation. Ecol. Model. 312, 166–174. https://doi.org/10.1016/j. ecolmodel.2015.05.018.
Jensen, J.R., 2008. Remote sensing of the environment: an earth resource perspective. Pearson Education, Delhi, India.
Kambulin, V.E., 2018. Locust – methods of assessing harm, forecasting the number and technologies for identifying populated areas. Almaty.
Kimathi, E., Tonnang, H.E.Z., Subramanian, S., Cressman, K., Abdel-Rahman, E.M., Tesfayohannes, M., Niassy, S., Torto, B., Dubois, T., Tanga, C.M., Kassie, M.,
Ekesi, S., Mwangi, D., Kelemu, S., 2020. Prediction of breeding regions for the desert locust Schistocerca gregaria in East Africa. Sci. Rep. 10, 11937. https://doi.org/ 10.1038/s41598-020-68895-2.
Klein, I., Oppelt, N., Kuenzer, C., 2021. Application of Remote Sensing Data for Locust Research and Management—A Review. Insects 12, 233. https://doi.org/10.3390/ insects12030233.
Kokanova, E.O., 2017. Natural foci of the Moroccan locust (Dociostaurus maroccanus, Orthoptera, Acrididae) in Turkmenistan and their current state. Entomol. Rev. 97 (5), 584–593. https://doi.org/10.1134/S0013873817050049.
Latchininsky, A., Piou, C., Franc, A., Soti, V., 2016. In: Land Surface Remote Sensing. Elsevier, pp. 263–293. https://doi.org/10.1016/B978-1-78548-105-5.50008-6. Latchininsky, A.V., 2013. Locusts and remote sensing: a review. J. Appl. Remote Sens. 7 (1), 075099. https://doi.org/10.1117/1.JRS.7.075099.
Latchininsky, A.V., 1998. Moroccan locust Dociostaurus maroccanus (Thunberg, 1815): a
faunistic rarity or an important economic pest? J. Insect Conserv. 167–178. Latchininsky, A.V., Sivanpillai, R., 2010. In: Integrated Management of Arthropod Pests and Insect Borne Diseases. Springer Netherlands, Dordrecht, pp. 163–188. https://doi.org/10.1007/978-90-481-8606-8_7.
Lazar, M., Aliou, D., Jeng-Tze, Y., Doumandji-Mitiche, B., Lecoq, M., 2015. Location and
Characterization of Breeding Sites of Solitary Desert Locust Using Satellite Images Landsat 7 ETM+ and Terra MODIS. Adv. Entomol. 03 (01), 6–15. https://doi.org/ 10.4236/ae.2015.31002.
Le Gall, M., Overson, R., Cease, A., 2019. A Global Review on Locusts (Orthoptera: Acrididae) and Their Interactions With Livestock Grazing Practices. Front. Ecol. Evol. 7, 263. https://doi.org/10.3389/fevo.2019.00263.
Leita ̃o, P.J., Santos, M.J., 2019. Improving Models of Species Ecological Niches: A Remote Sensing Overview. Front. Ecol. Evol. 7, 9. https://doi.org/10.3389/ fevo.2019.00009.
Lobo, J.M., Jim ́enez-Valverde, A., Real, R., 2008. AUC: a misleading measure of the performance of predictive distribution models. Glob. Ecol. Biogeogr. 17 (2), 145–151. https://doi.org/10.1111/j.1466-8238.2007.00358.x.
Mahlstein, I., Daniel, J.S., Solomon, S., 2013. Pace of shifts in climate regions increases with global temperature. Nat. Clim. Change 3 (8), 739–743. https://doi.org/ 10.1038/nclimate1876.
Malakhov, D.V., Zlatanov, B.V., 2020. An Ecological Niche Model for Dociostaurus maroccanus, Thunberg, 1815 (Orthoptera, Acrididae): The Nesting Environment and Survival of Egg-Pods. BiosisBiological Syst. 1, 08–24. https://doi.org/10.37819/ biosis.001.01.0048.
Meynard, C.N., Lecoq, M., Chapuis, M.-P., Piou, C., 2020. On the relative role of climate change and management in the current desert locust outbreak in East Africa. Glob. Change Biol. 26 (7), 3753–3755. https://doi.org/10.1111/gcb.15137.
Monard, A., Chiris, M., Latchininsky, A.V., 2009. Analytical report on locust situations and management in caucasus and central asia (cca). FAO.
Oldham, R.S., Keeble, J., Swan, M.J.S., Jeffcote, M., 2000. Evaluating the suitability of habitat for the great crested newt (Triturus cristatus). Herpetol. J. 10, 143–155. Pekel, J.-F., Ceccato, P., Vancutsem, C., Cressman, K., Vanbogaert, E., Defourny, P., 2011.
Development and Application of Multi-Temporal Colorimetric Transformation to Monitor Vegetation in the Desert Locust Habitat. IEEE J. Sel. Top. Appl. Earth Obs. Remote Sens. 4 (2), 318–326. https://doi.org/10.1109/JSTARS.2010.2052591.
Predicting suitable breeding areas for different locust species – A multi-scale approach accounting for environmental conditions and current land cover situation
Peterson, A.T., 2006. Uses and Requirements of Ecological Niche Models and Related Distributional Models. Biodivers. Inform. 3 https://doi.org/10.17161/bi.v3i0.29.
Pflug, B., Louis, J., Debaecker, V., Müller-Wilm, U., Quang, C., Gascon, F., Boccia, V., 2020. Next updates of atmospheric correction processor Sen2Cor. In: Notarnicola, C., Bovenga, F., Bruzzone, L., Bovolo, F., Benediktsson, J.A., Santi, E., Pierdicca, N. (Eds.), Image and Signal Processing for Remote Sensing XXVI. Presented at the Image and Signal Processing for Remote Sensing XXVI, SPIE, Online Only, United Kingdom, pp. 2. http://dx.doi.10.1117/12.2574035.
Piou, C., Gay, P.-E., Benahi, A.S., Babah Ebbe, M.A.O., Chihrane, J., Ghaout, S., Cisse, S., Diakite, F., Lazar, M., Cressman, K., Merlin, O., Escorihuela, M.-J., Mcinnis-Ng, C., 2019. Soil moisture from remote sensing to forecast desert locust presence. J. Appl. Ecol. 56 (4), 966–975. https://doi.org/10.1111/1365-2664.13323.
Piou, C., Lebourgeois, V., Benahi, A.S., Bonnal, V., Jaavar, M.e.H., Lecoq, M., Vassal, J.- M., 2013. Coupling historical prospection data and a remotely-sensed vegetation index for the preventative control of Desert locusts. Basic Appl. Ecol. 14 (7), 593–604. https://doi.org/10.1016/j.baae.2013.08.007.
Poggio, L., de Sousa, L.M., Batjes, N.H., Heuvelink, G.B.M., Kempen, B., Ribeiro, E., Rossiter, D., 2021. SoilGrids 2.0: producing soil information for the globe with quantified spatial uncertainty. SOIL 7 (1), 217–240. https://doi.org/10.5194/soil-7- 217-202110.5194/soil-7-217-2021-supplement.
Raes, N., ter Steege, H., 2007. A null-model for significance testing of presence-only species distribution models. Ecography 30 (5), 727–736. https://doi.org/10.1111/ j.2007.0906-7590.05041.x.
Reuters, 2019. Sardinia hit by worst locust invasion for 70 years. https://www.reuters. com/article/us-italy-locusts-idUSKCN1TC1BY.
Robin, X., Turck, N., Hainard, A., Tiberti, N., Lisacek, F., Sanchez, J.-C., Müller, M., 2011. pROC: an open-source package for R and S+ to analyze and compare ROC curves. BMC Bioinformatics 12, 77. https://doi.org/10.1186/1471-2105-12-77.
Salih, A.A.M., Baraibar, M., Mwangi, K.K., Artan, G., 2020. Climate change and locust outbreak in East Africa. Nat. Clim. Change 10 (7), 584–585. https://doi.org/ 10.1038/s41558-020-0835-8.
Senay, S.D., Worner, S.P., Ikeda, T., Davies, A., 2013. Novel Three-Step Pseudo-Absence Selection Technique for Improved Species Distribution Modelling. PLoS ONE 8 (8), e71218. https://doi.org/10.1371/journal.pone.007121810.1371/journal. pone.0071218.g00110.1371/journal.pone.0071218.g00210.1371/journal. pone.0071218.g00310.1371/journal.pone.0071218.g00410.1371/journal. pone.0071218.g00510.1371/journal.pone.0071218.g00610.1371/journal. pone.0071218.g00710.1371/journal.pone.0071218.g00810.1371/journal. pone.0071218.g00910.1371/journal.pone.0071218.g01010.1371/journal. pone.0071218.t00110.1371/journal.pone.0071218.t00210.1371/journal. pone.0071218.s001.
Sergeev, M., Childebaev, M.K., Vankova, I.A., Gapparov, F.A., Kambulin, V.E., Kokanova, E., Latchininsky, A.V., Pshenitsyna, L.B., Temreshev, I.I., Tschernjachowski, M.E., Sobolev, N.N., Molodcov, V.V., 2016. Italian locust : morphology, distribution, ecology, population control. FAO, Rome.
Sergeev, M.G., 2021. Ups and Downs of the Italian Locust (Calliptamus italicus L.) Populations in the Siberian Steppes: On the Horns of Dilemmas. Agronomy 11, 746. https://doi.org/10.3390/agronomy11040746.
Sergeev, M.G., Van’kova, I.A., 2008. The Dynamics of a Local Population of the Italian Locust (Calliptatus italicus L.) in an Anthropogenic Landscape 1, 8.
Sivanpillai, R., Latchininsky, A.V., Peveling, R., Pankov, V.I., Diagnosis, P., 2009. Utility of the IRS-AWiFS Data to Map the Potential Italian Locust (Calliptamus italicus) Habitats in Northern Kazakhstan. In: Presented at the American Society for Photogrammetry and Remote Sensing Annual Conference (ASPRS), Baltimore, USA.
Steedman, A. (Ed.), 1990. Locust handbook, third ed. Chatham, UK.
Stone, M., 2020. A plague of locusts has descended on East Africa. Climate change may be to blame. Natl. Geogr. Sci.
Symmons, P.M., Cressman, K., 2001. Desert Locust Guidelines – 1. Biology and behaviour, second ed. FAO, Rome.
Takaku, J., Tadono, T., Doutsu, M., Ohgushi, F., Kai, H., 2020. Updates of ‘AW3D30’ ALOS global digital surface model with other open access datasets. Int. Arch. Photogramm. Remote Sens. Spat. Inf. Sci. XLIII-B4-2020, 183–189. http://dx.doi.10. 5194/isprs-archives-XLIII-B4-2020-183-2020.
Toleubayev, K., Jansen, K., van Huis, A., 2007. Locust Control in Transition: The Loss and Reinvention of Collective Action in Post-Soviet Kazakhstan. Ecol. Soc. 12, art38. https://doi.org/10.5751/ES-02229-120238.
Tratalos, J.A., Cheke, R.A., Healey, R.G., Stenseth, N.C., 2010. Desert locust populations, rainfall and climate change: insights from phenomenological models using gridded monthly data. Clim. Res. 43 (3), 229–239. https://doi.org/10.3354/cr00930.
Tsychuyeva, N.Y., Muratova, N.R., Malakhov, D.V., Kambulin, V.E., Aisarova, A., 2017. Space monitoring of the nesting areas of locust species in Kazakhstan since 2000. Sovrem. Probl. Distantsionnogo Zondirovaniya Zemli Iz Kosmosa 14 (6), 137–148. https://doi.org/10.21046/2070-7401-2017-14-6-137-148.
Tuanmu, M.-N., Jetz, W., 2015. A global, remote sensing-based characterization of terrestrial habitat heterogeneity for biodiversity and ecosystem modelling: Global habitat heterogeneity. Glob. Ecol. Biogeogr. 24 (11), 1329–1339. https://doi.org/ 10.1111/geb.12365.
Uvarov, B.P., 1957. The aridity factor in the ecology of locusts and grasshoppers of the Old World. In: Arid Zone Research. Paris.
van Huis, A., Cressman, K., Magor, J.I., 2007. Preventing desert locust plagues: optimizing management interventions. Entomol. Exp. Appl. 122 (3), 191–214. https://doi.org/10.1111/j.1570-7458.2006.00517.x.
Veran, S., Simpson, S.J., Sword, G.A., Deveson, E., Piry, S., Hines, J.E., Berthier, K., 2015. Modeling spatiotemporal dynamics of outbreaking species: influence of environment and migration in a locust. Ecology 96 (3), 737–748. https://doi.org/10.1890/14- 0183.110.1890/14-0183.1.sm.
Wakeley, J.S., 1988. A method to create simplified versions of existing habitat suitability index (HSI) models. Environ. Manage. 12 (1), 79–83. https://doi.org/10.1007/ BF01867379.
Walz, Y., Wegmann, M., Dech, S., Vounatsou, P., Poda, J.-N., N’Goran, E.K., Utzinger, J., Raso, G., Remais, J.V., 2015. Modeling and Validation of Environmental Suitability for Schistosomiasis Transmission Using Remote Sensing. PLoS Negl. Trop. Dis. 9 (11), e0004217. https://doi.org/10.1371/journal.pntd.000421710.1371/journal. pntd.0004217.g00110.1371/journal.pntd.0004217.g00210.1371/journal. pntd.0004217.g00310.1371/journal.pntd.0004217.g00410.1371/journal. pntd.0004217.t00110.1371/journal.pntd.0004217.t00210.1371/journal. pntd.0004217.t00310.1371/journal.pntd.0004217.t00410.1371/journal. pntd.0004217.s00110.1371/journal.pntd.0004217.s00210.1371/journal. pntd.0004217.s003.
Warren, A., Litvaitis, J.A., Keirstead, D., 2016. Developing a habitat suitability index to guide restoration of New England cottontail habitats: New England Cottontail HSI. Wildl. Soc. Bull. 40 (1), 69–77.
Zajac, Z., Stith, B., Bowling, A.C., Langtimm, C.A., Swain, E.D., 2015. Evaluation of habitat suitability index models by global sensitivity and uncertainty analyses: a case study for submerged aquatic vegetation. Ecol. Evol. 5 (13), 2503–2517. https://doi. org/10.1002/ece3.1520.
Zaniewski, A.E., Lehmann, A., Overton, J.M., 2002. Predicting species spatial distributions using presence-only data: a case study of native New Zealand ferns. Ecol. Model. 157 (2-3), 261–280. https://doi.org/10.1016/S0304-3800(02)00199-0.
Zhang, L., Lecoq, M., Latchininsky, A., Hunter, D., 2019. Locust and Grasshopper Management. Annu. Rev. Entomol. 64 (1), 15–34. https://doi.org/10.1146/ annurev-ento-011118-112500.
Zhu, Z., Wang, S., Woodcock, C.E., 2015. Improvement and expansion of the Fmask algorithm: cloud, cloud shadow, and snow detection for Landsats 4–7, 8, and Sentinel 2 images. Remote Sens. Environ. 159, 269–277. https://doi.org/10.1016/j. rse.2014.12.014.