
Authors: Dmitry V. Malakhov and Marina A. Chirikova
Abstract: A species distribution model has been developed for one of the most well-studied varanid lizards — Varanus griseus caspius. The model was developed based on several hundred documented localities of the lizard and a number of abiotic variables using statistical and GIS-based approaches. The results of evaluation using the model demonstrated the appropriate spatial accuracy of the model.
What is more important, the analysis of key variables as revealed by the model and its comparison to the published information on the biology of the Desert Monitor demonstrated the value of the species distribution model as a tool for providing additional and reliable information on certain aspects of species biology. Known data on V. griseus confirms the validity of the selection of key variables by statistical modeling of living species in suitable habitat conditions. The method of Species Distribution Modeling may be of use when studying poorly-known species, as it is able to draw the researcher’s attention to certain environmental factors previously unknown or unavailable for direct observation. The map of potential distribution of the Desert Monitor and the list of key abiotic variables are discussed in detail, emphasizing the impact of temperature and moisture on different stages of the lizard’s annual cycle. The particular impact of some key variables remains questionable. This problem may be explained in two ways. First, the species distribution model is quite imperfect as it deals with a limited set of variables which does not include biotic factors such as food availability; the pattern of vegetation; the presence of competing species; the existence of natural barriers; and others. Another explanation is more speculative and sophisticated as it assumes a lack of knowledge concerning certain aspects of the organism’s life-cycle and the complex nature of the interaction of abiotic factors. However, the value of Species Distribution Modeling should not be underestimated, as the modeling procedure is unaffected by the “human factor” and the subjectivity of an individual researcher.
Keywords: Varanus griseus; species distribution model; Central Asia.
PDF-version of the article:
INTRODUCTION
Varanus griseus (Daudin, 1803) is widely distributed in North Africa, India, South-Western Asia and Central Asia. Three subspecies of Varanus griseus have been identified: Varanus g. koniecznyi Mertens, 1942, V. g. griseus (Daudin, 1803) and V. g. caspius (Eichwald, 1831) (Mertens, 1954; Bennett, 1995; Sindaco and Jeremèenko, 2008). V. g. caspius, the Central Asian subspecies, inhabits the area from the eastern coast of the Caspian Sea, through the Central Asian deserts and Northern Iran to Western and Southern Afghanistan and Western Pakistan (Leviton and Anderson, 1970; Bennett, 1995; Zarydny, 1915).
The numbers of V. griseus decreased in the twentieth century due to intensive hunting at the beginning of the century, when monitors’ pelts were taken in tremendous number (Paraskiv, 1956). Later, when hunting was stopped, the reclamation of agricultural land became very intensive and triggered a further decrease in lizard numbers. Recently, the Desert Monitor has disappeared from the Fergana Valley; and its numbers have decreased in the Kopet-Dag Mountain foothills and the Harsha Steppe. In Uzbekistan, the area of land suitable for the Desert Monitor has reduced by up to 40% in the second half of the twentieth century (Bondarenko, 1989; Tsellarius et al., 1991).
Recent studies devoted to Desert Monitor distribution have revealed many uncertainties about the actual distribution of the species, especially in the northern portion of its area (Nuridzhanov et al., 2016). The territory inhabited by the Desert Monitor comprises huge areas where access is extremely difficult and a direct field survey is thus very hard to carry out. Ecological niche modeling (ENM), in the form of the Species Distribution Model (SDM) in this case, is one of the cost-effective and reliable tools for estimating recent and, most importantly, potential areas of habitation for the species.
ENM (SDM) has been the focus of recent scientific studies which have shown its promise (Franklin, 2012; Khafagi et al., 2012; Graham and Hijmans, 2006; Raxworthy et al., 2007). The modeling itself involves the determination by a number of algorithms of the biotic and abiotic variables that depict the life cycle of a species and its spatial distribution. It should be noted that the modeling procedure involves the measuring of probabilities; and the result of the modeling procedure represents the probable rather than the actual area of the distribution of the species.
The ecological niche, in general terms, is a complex of environmental variables, delimiting the species’ existence. Joseph Grinnell was apparently the first to introduce the concept of the ecological niche in 1914 (Pocheville, 2015). The term “ecological niche” usually encompasses the relationships of many species, all functioning within the common food chain. Having its own niche in the biogeocenosis, the species competes with other species of the given natural community for food, space and other life conditions. For the purposes of our study, we accept the theory of George Hutchinson (1957), who formalized the niche concept as an attribute of the species rather than the environment. Hutchinson’s niche exists in a space (n-dimensional hypercube) occupied by biotic and abiotic environmental variables, some of which represent the limits of species viability (Hutchinson, 1957). It is possible to distinguish: 1) a spatial niche related to the peculiarities of species distribution; 2) a functional (trophic) niche, related to food sources; the metabolic and growth ratios; the co-influence of a given species on others etc.; 3) a multidimensional niche in n-dimensional hyperspace, where “n” represents the number of all variables and relationships, allowing successful species reproduction. Using Hutchinson’s formal definition of the ecological niche, it is possible to describe and quantitatively estimate all types of ecological niche, although with differing degrees of accuracy (Hutchinson, 1957).
GIS-based ENMGSDM is a rapidly developing area of research that has many different approaches and types of focus (Rushton et al., 2004). Recently, the GIS-based ENMGSDM approach was applied to very different groups of living organisms. Aguilar and Lado (2012) developed an ENM for protists. Recently, for example, studies have been published covering the ENM of fungi (Malakhov et al., 2017) and plant species (Babar et al, 2012); insects (Beaumont et al., 2005; Ayala et al., 2009; Sanchez et al., 2015); herps (Malakhov and Dujsebayeva, 2014; Litvinchuk et al., 2013, 2014; Skorinov et al., 2014; Tarkhnishvili et al., 2009; Groff et al., 2013; Ray et al., 2002; Doronin, 2012; Escoriza et al., 2011; Tupikov and Ukrainskiy, 2016; Tytar and Nekrasova, 2016; Ananjeva and Golynskiy, 2013, etc.); birds (Peterson and Robins, 2003; Parra et al., 2004); mammals (Rood et al., 2010; Kayijamahe, 2008, etc.); and even cryptozoological objects (Lozier et al., 2009). GIS-based ENM modelling is actively used not for species distribution modeling only. This approach functions as a reliable tool for studies of past and future climatic scenarios (Waltari et al., 2007; Dujsebaeva et al., 2014).
The main goals of the current paper are to develop the SDM of the Desert Monitor and to evaluate the usefulness of the SDM approach in the understanding of species biology based on a very well-studied subject — V. griseus caspius.
MATERIAL AND METHODS
Following an initial taxonomical review of the most southerly populations of V. griseus (Böhme et al., 2015), we used only data on the distribution of this lizard in Central Asia (Kazakhstan, Kyrgyzstan, Tajikistan, and Uzbekistan) to develop the current model. A total of 526 ground localities were obtained from own and published observations on the distribution of the Desert Monitor, along with catalogue data from museums (the Zoological Institute RAS, St. Petersburg, Russia; Samarkand State University, Uzbekistan; and the Institute of Plant and Animal Gene Pool, Tashkent, Uzbekistan). Lizard records were registered with a GPS receiver in decimal degrees. The Desert Monitor is a highly mobile animal, capable of travelling up to 10 kilometers from its burrow in a single day (Tsellarius et al., 1991; Brushko, 1995). For this reason, we used approximate coordinates in some cases (especially for previously published information).
The following climatic data sets were applied to develop the species SDM: WorldClim (monthly temperatures and precipitation); BioClim (a set of variables derived from WorldClim and meteorological stations) (http:GGwww.worldclim.org); Global Potential EvapoTranspiration (http:GGwww.cgiar-csi.orgGdataGglobalaridity-and-pet-database); Digital Elevation Model and its derivatives (exposition, slope, curvature etc.). Input data and model development were performed in the ESRI ArcGIS 10.1 environment. A detailed description of climatic variables is available on-line and was published in scientific papers (Beaumont et al., 2005; O’Donnel and Ignizio, 2012; Hijmans et al., 2005; Booth et al., 2014; Kriticos et al., 2012). ENMGSDM was based on the method previously described in detail by Malakhov et al. (2017) and Dujsebayeva and Malakhov (2017).
RESULTS AND DISCUSSION
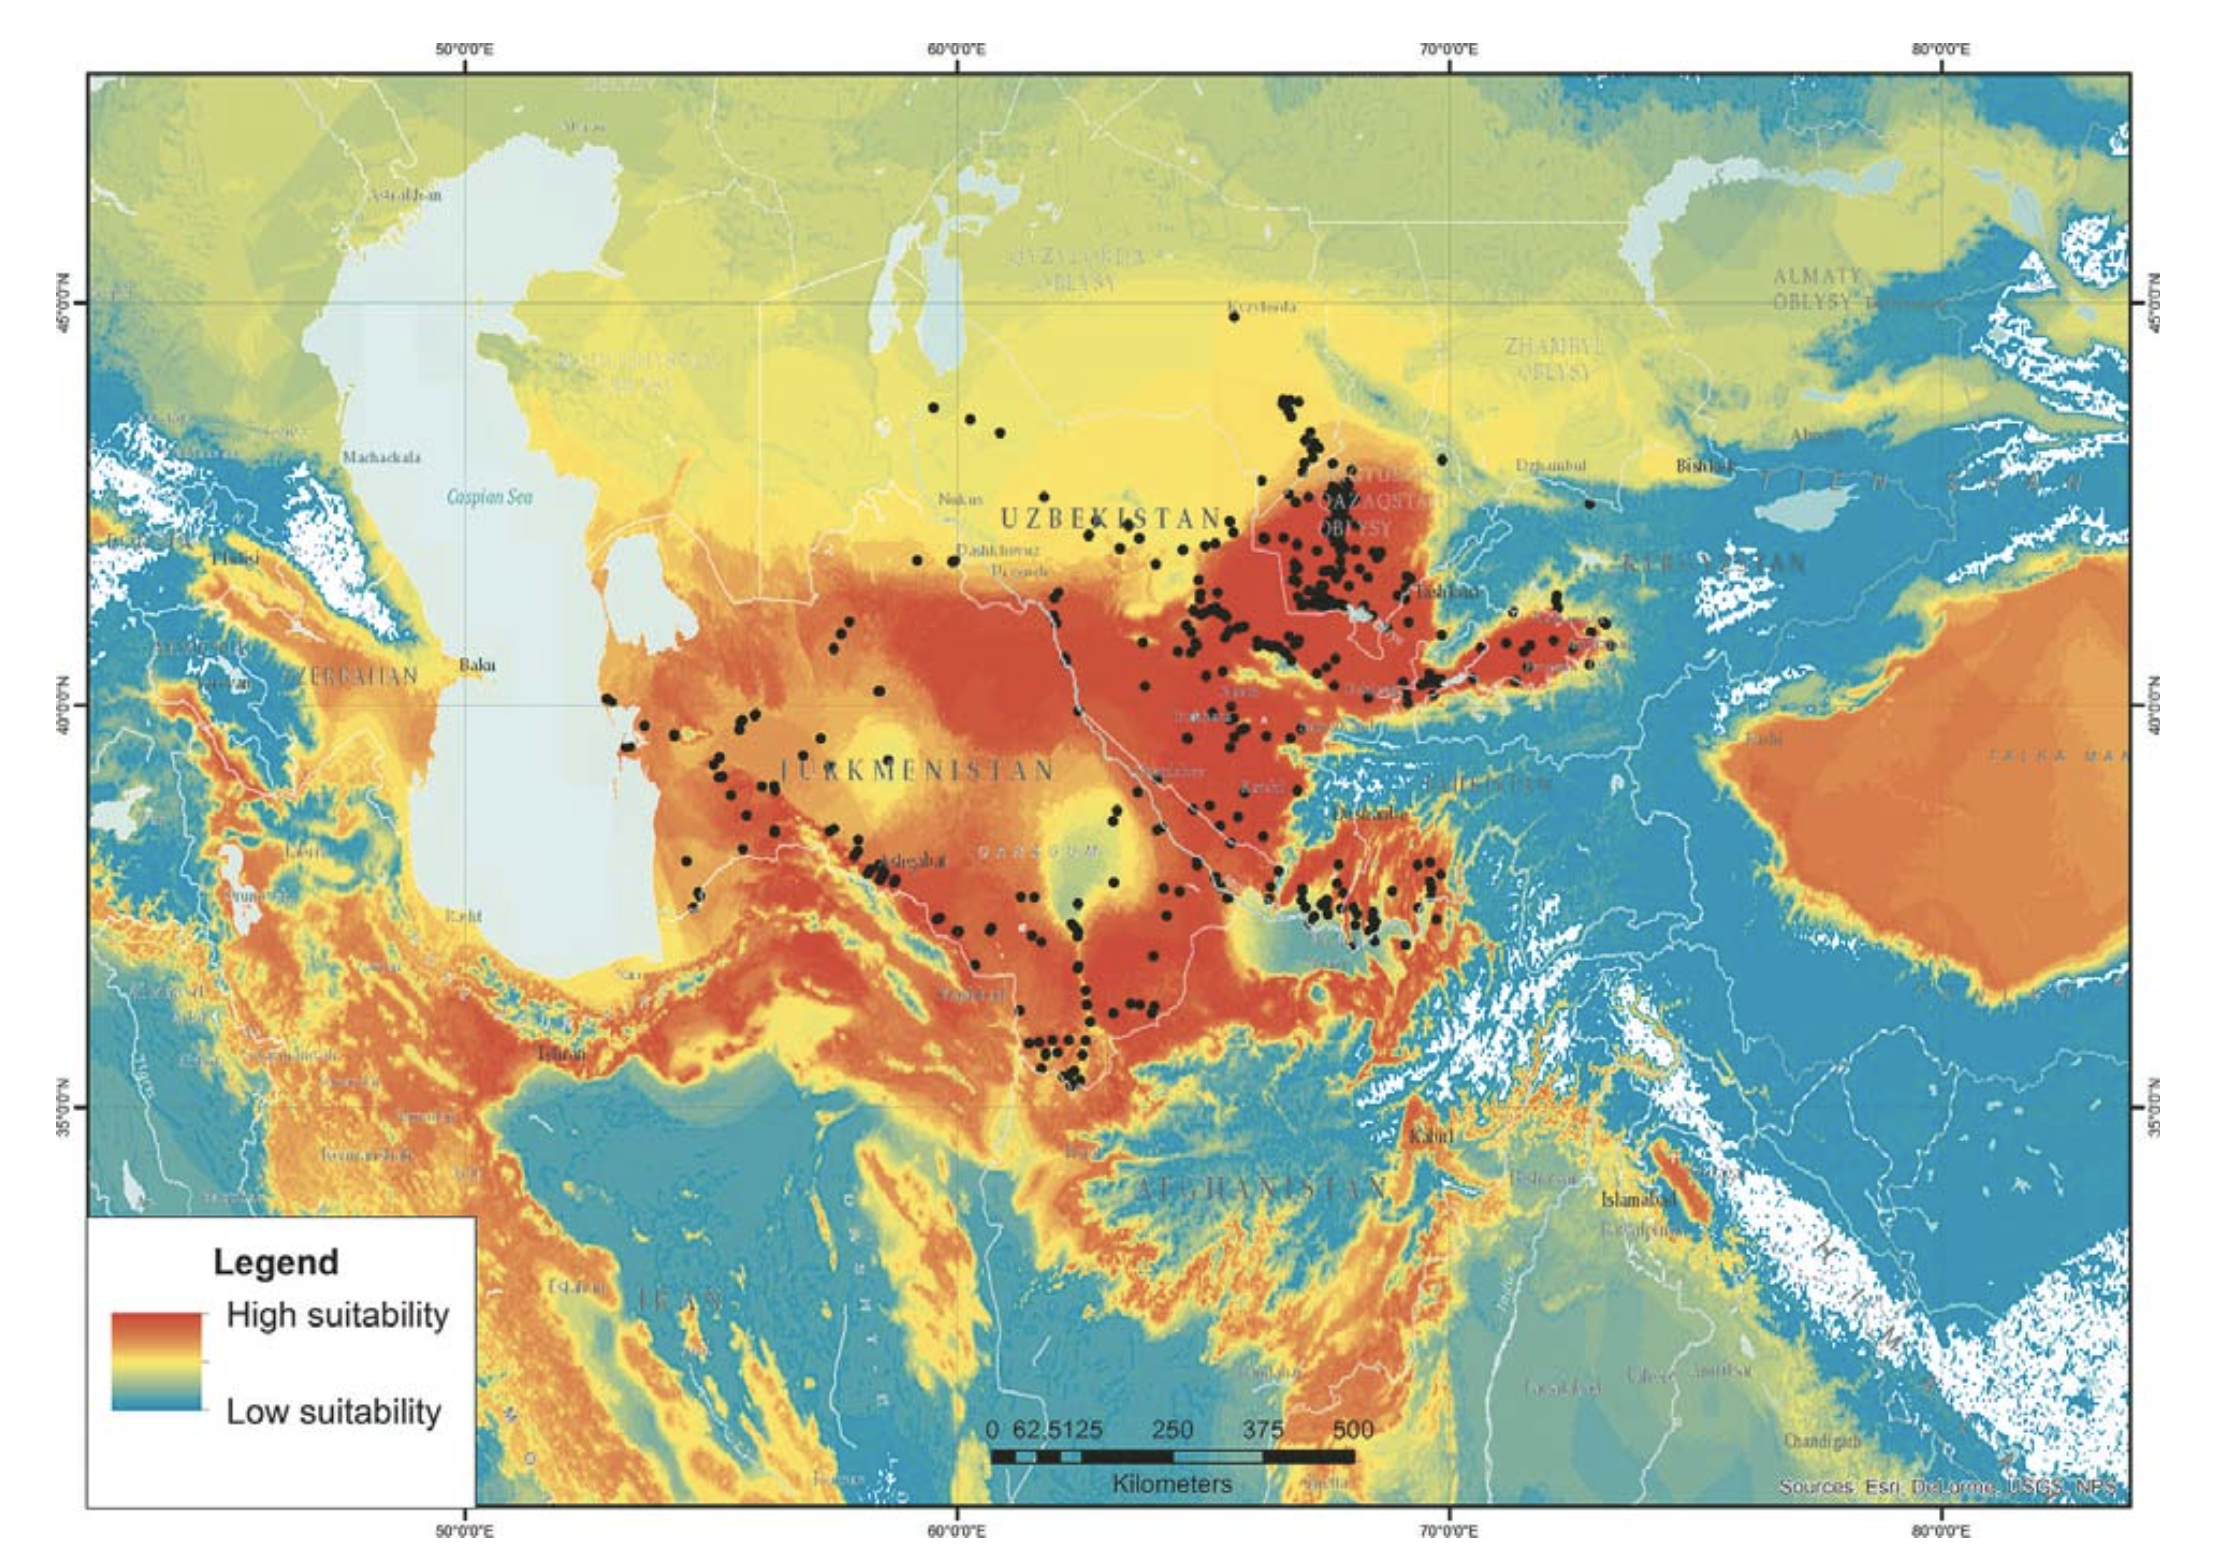
The correspondence of the model to the actual distribution of the monitor will be discussed in detail elsewhere. In general, the SDM pattern of the habitat of V. griseus caspius as revealed by the current model corresponds to the previously outlined species area (Sindaco and Jeremèenko, 2008). The most suitable habitats are located in Southern Kazakhstan (the Eastern Kyzilkum Desert); Eastern Uzbekistan with the Fergana Valley, Tajikistan; Northern and Eastern Iran; the foothill areas of Pakistan and Afghanistan and part of Northern India (Fig. 1). As shown by the model, the northern boundary of the suitable habitats for the Desert Monitor corresponds to the border between the North Kyzylkum and East Kyzylkum climatic regions (Puzirjeva, 1975). These regions differ in precipitation modes and the duration of the warm season. The East Kyzylkum region has its precipitation minimum in the summer and its precipitation maximum in the early spring. The summer is 1.5 – 2 months longer in the East Kyzylkum region, whereas the summer in North-Kyzylkum is shorter and its annual precipitation trend has a more uniform distribution. It is possible to hypothesize that the North Kyzylkum region is not favorable to egg incubation and the survival of juveniles’ survival.
V. griseus is the northernmost species of the genus Varanus and its distribution area is the largest among the monitor lizards. V. griseus is mainly a desert species but it also inhabits semi-arid and non-arid areas. It inhabits some of the most hostile regions of the Earth, experiencing blistering heat in the summer and extreme cold in the winter (Bennet, 1995). Its typical habitats are the sand dunes, clay steppes, riverbeds and savannah plains up to altitudes of 1300 m a.s.l. V. griseus is distributed over an array of climatic zones: from dry-subtropical to dry terrestrial. Besides the climate, the main factor limiting its distribution seems to be the availability of sandy or light soils in which it can burrow (Stanner, 2004). According to Kovda (1973), the precipitation over most of the Desert Monitor area has a prominent winter maximum and remains relatively low in the summer. Temperature is an important factor, which not only delimits the comfort zone for a single animal but also regulates the entire life-cycle. Reproductive activity is regulated, among other factors, by temperature as well, since the increasing temperature stimulates testicular activity (Auffenberg et al., 1990).
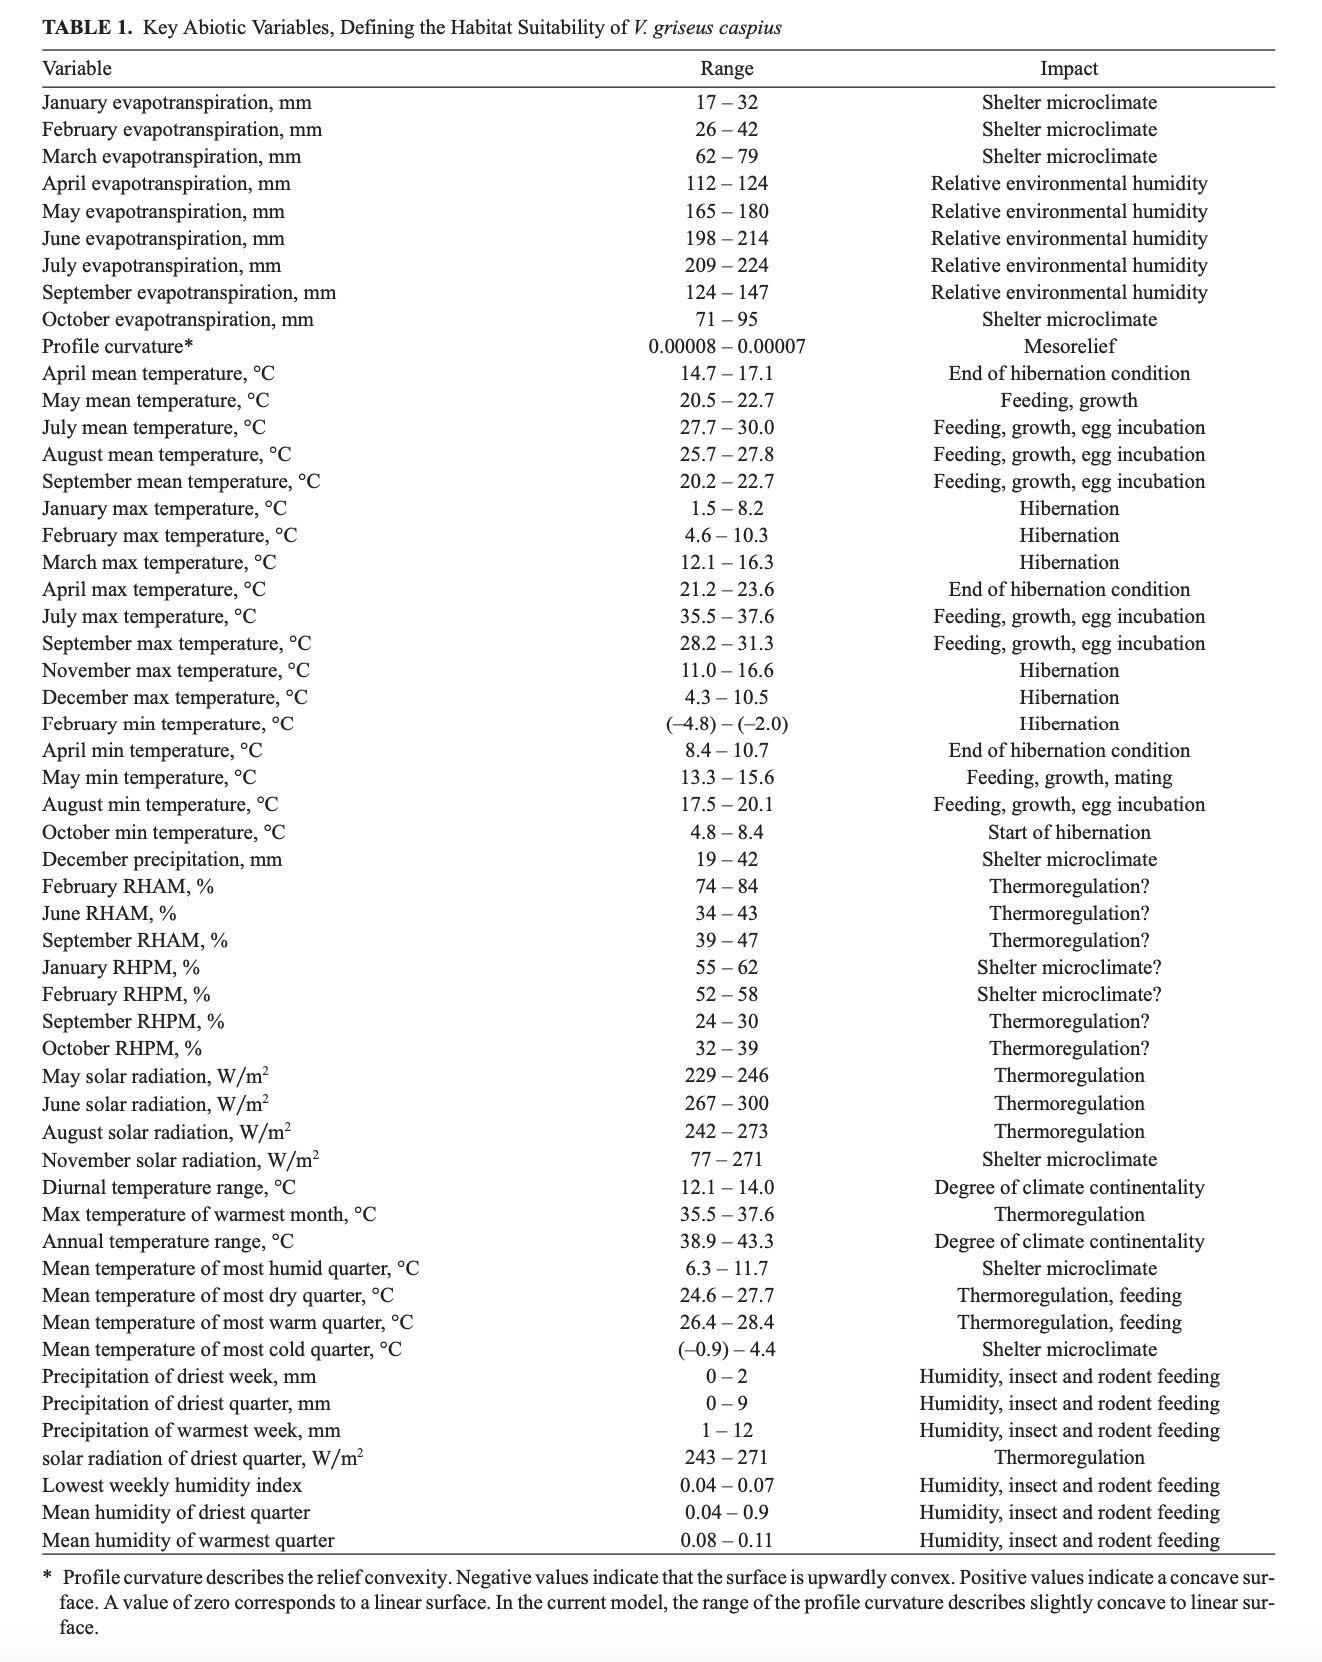
Evapotranspiration in the spring, summer and autumn months is apparently related to the total humidity of the environment, which in turn depends upon the complex interaction of soil and air water content. RHAM (relative air humidity in the morning), RHPM (relative air humidity afternoon) and Mean Humidity outline the particular case of moisture-balance representation. The air humidity of the winter months may be related to moistening of uppermost soil layer, which, as is discussed below, is one of the most important factors in soil warming during the cold season of the year. In the warm season, the air humidity is also reflected in the soil moisture content as well. Soil moisture in the warm season regulates vegetation growth and is a factor in the soil-atmosphere energy flux. Solar radiation in the summer season acts as a regulator of the diurnal activity of the Desert Monitor and, at the same time, affects vegetation growth alongside warm-season precipitation. Precipitation in December may be related to the capacity of the snow cover to prevent the freezing of the topmost soil layer. Diurnal and annual temperature ranges point to a temperate continental climate. Other variables are related to air temperature; and the impact of temperature will be discussed below (Table 1).
In in the south of Central Asia, the Desert Monitor emerges from its winter shelters in March (Uzbekistan and Turkmenistan; Bogdanov, 1960; Atayev, 1985); and in mid-April to early May in Kazakhstan (Brushko, 1995). It can be assumed that, in Central Asia, mating takes place in the period from May to June. Females with eggs have been documented in late May to June (Bogdanov, 1960). Incubation lasts about 120 days (July – September), which is an unusually short period for such a big varanid. The juveniles hatch in autumn and usually stay in their shelters until mid-April or early May of the following year, rarely appearing on the surface during September to October of the current year (Tsellarius et al., 1991; Atayev, 1985). The hatchlings have a snoutvent length (SVL) of around 11 – 18 cm. In the first autumn, the juvenile SVL reaches 25 cm. The SVL of a mature specimen (about 40 cm) can be attained before the third hibernation. Hibernation shelters are located at depth of 65 – 200 cm, i.e., within a stable soil-temperature environment. The animal emerges in the spring, from mid-April to early May, and starts actively feeding about a month later. Peak activity is during the period May to June and the activity pattern is very uniform across several climatic zones (Stanner, 2004).
Based on the above, the annual activity of the Desert Monitor can be divided into four stages (Tsellarius and Menshikov, 1994):
1.
Winter hibernation (October – March);
2. Establishing period (April – beginning of June); 3. Mating (about 10 days);
4. Private period: mostly hunting (from end of June until the hibernation).
Temperature effects
Body temperature range may vary among different varanid species, being slightly higher in desert Australian animals (Pianka, 1994), or lower in some arboreal forms (Varanus tristis — Thompson et al., 1998), but it does not exceed the natural physiological thresholds of the enzymes denaturation (Okafor, 2010). The study of two sympatric monitor lizards — the terrestrial V. bengalensis and the aquatic V. salvator — with radio-tracking, demonstrated the similar energetic requirements of two species, having different ecological adaptations (Wykramanayake, 1995). Active body temperature in ectotherms is physiologically based and has low seasonal changeability (Tsellarius and Tsellarius, 1997).
The range of body temperature in V. g. caspius varies from 5 to 42°C (Bennet, 1995; Tsellarius et al., 1991) — lower or higher body temperature usually causes death. The mean body temperature of an active specimen varies from 36 to 38°C (Tsellarius et al., 1991; Tsellarius and Tsellarius, 1997; Ibrahim, 2000). The soil temperature during incubation varies from 25.5 to 32.5°C. Soil temperature in October falls beneath the optimal incubation range; and it has been hypothesized that embryos are not able to develop fully in some years at the northern border of the species’ area (Tsellarius and Cherlin, 1994). Hibernating usually starts in September (Tsellarius et al., 1991). The mean active-body temperature is one of the most important regulating factors for V. griseus. The mean hibernating temperature is 15.8 ± 1.2°C and ranges from 15 to 30.5°C (Ibrahim, 2000; Tsellarius et al., 1991). Below 20°C, the Desert Monitor becomes inactive. The body temperature in hibernation lies between 16°C and 18°C.
As with other reptiles, the Desert Monitor is a poikilothermic (exothermic) animal. It uses mainly behavioral methods in order to undertake thermoregulation. Behavioral thermoregulation assumes basking in the morning, avoidance of the overheated substrate and winter hibernation in deep burrows. The Central Asian Desert Monitor prefers dense, turfed sands with sparse shrubs within a developed mesorelief (Tsellarius et al., 1991). The “mesorelief” condition fits well with the ridge, ridgehilly and barchans-hilly sands representing the most usual landscapes within the area inhabited by the Desert Monitor (Tsellarius and Tsellarius, 1997). However, the animal may be found in different substrates (Bondarenko, 1989; Tsellarius et al., 1991; Brushko, 1995). Some specimens were documented among large calcareous rocks at the edge of cultivated areas and even in gravel plains (Ilgaz et al., 2008; Nuridzhanov et al., 2016). 280 of 513 known localities of V. griseus used in the current study fall within the range of Sandy Desert according to the map of Petrov (1973).
Bearing in mind this brief summary of the environmental peculiarities of the Desert Monitor, it is now possible to discuss the importance of the statistically significant key abiotic factors as probable indicators of other, poorly-understood, aspects of the biology of the species. The section below demonstrates the close relationship of key factors as revealed by the model (and the trustworthiness of the abiotic datasets used for development of the model) to specific requirements and preferences of the studied species.
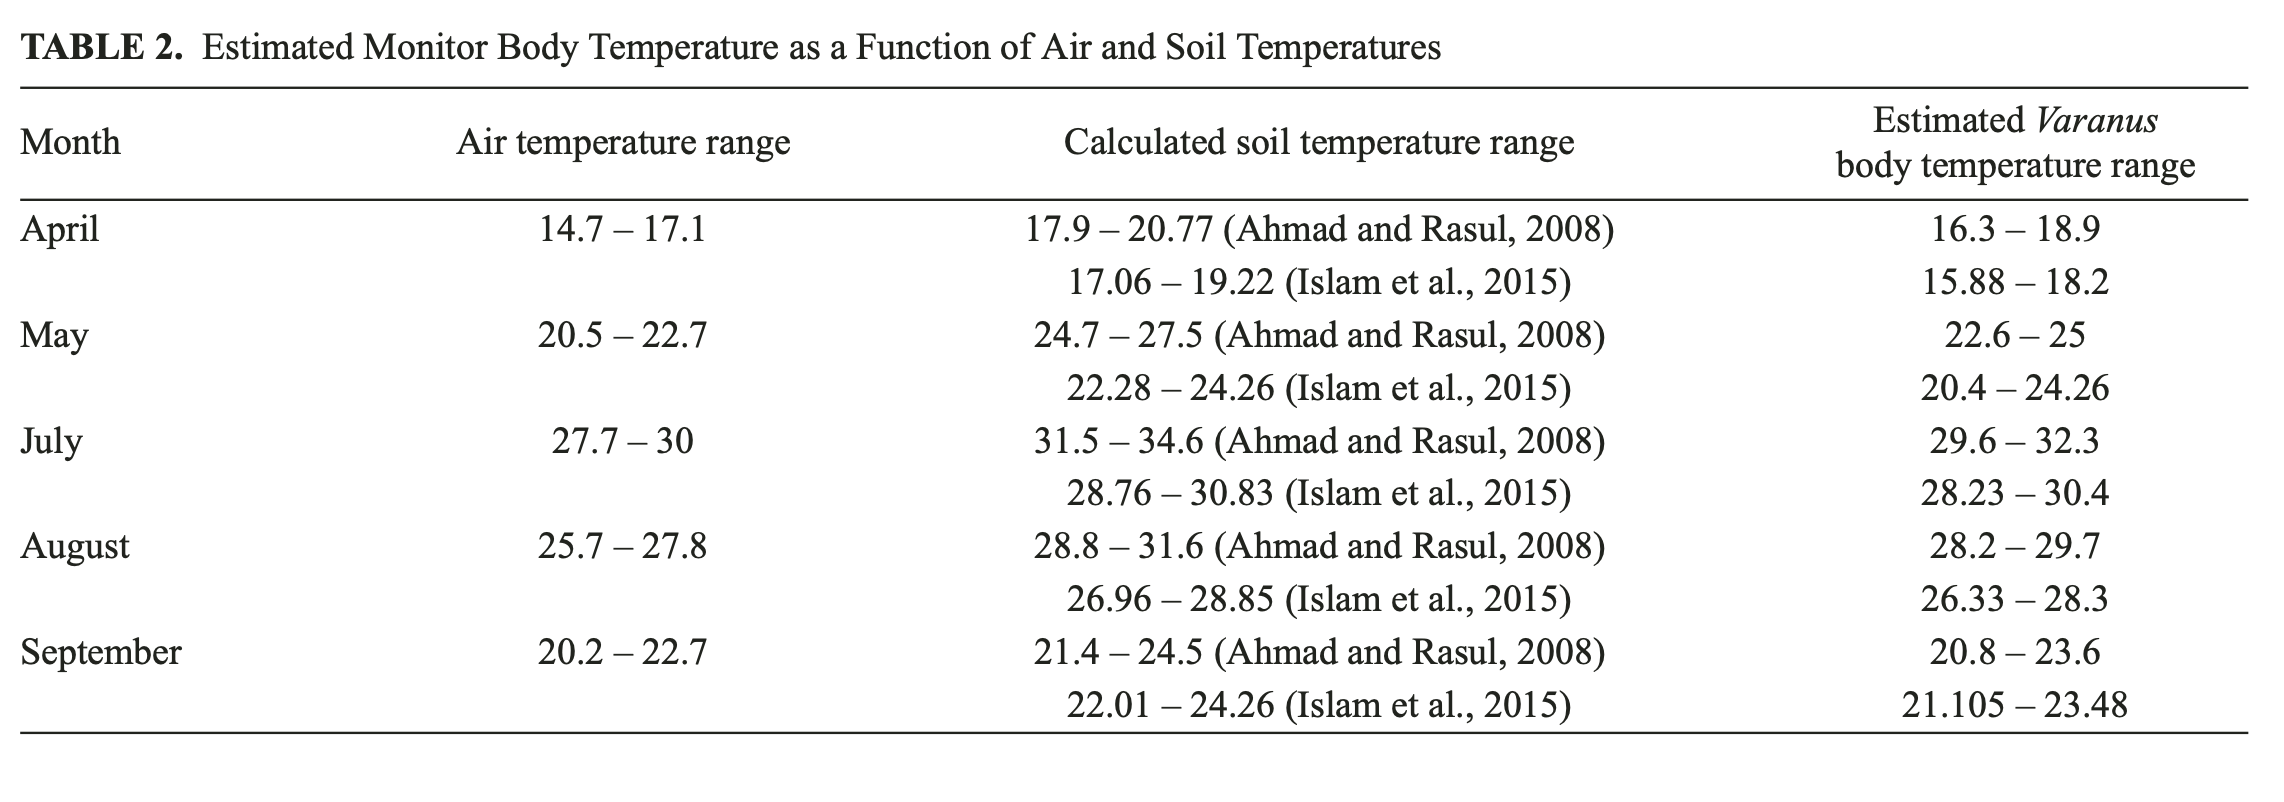
Body temperature, as the main physiological index of the Desert Monitor, depends on two factors — air and soil temperature (Tsellarius and Tsellarius, 1997). From the climatic dataset used in the current study, it is only possible to acquire air temperatures, which give no direct evidence about the lizard’s body temperature. However, as was demonstrated by Tsellarius and Tsellarius (1997), the body temperature of the Desert Monitor is clearly a function of air and soil temperature and can be estimated as half the difference of the air and soil temperatures plus the air temperature. A strong positive correlation between the air temperature (used in the current model) and soil temperature has been repeatedly demonstrated in many studies (Ahmad and Rasul, 2008; Islam et al., 2015; Zheng et al., 1993). The soil temperature may be derived from the air temperature by simple calculation following the method of Ahmad and Rasul (2008) and Islam et al. (2015).
Based on these methods and using the monthly mean temperature for April, May, July, August and September, we attempted to estimate the monitor’s body temperature in the “key” months listed in Table 1. The results of indirect body-temperature calculations are given in Table 2.
Soil temperature was calculated using different although still simple linear equations (Ahmad and Rasul, 2008; Islam et al., 2015). The applicability of the equations used and the accuracy of the soil-temperature calculations lies outside the scope of this paper. However, even very approximate results from estimates of body temperature for the Desert Monitor reveal a good concordance of the estimated and actual temperatures, in spite of the estimated temperatures appearing to be somewhat lower than measured in the field. An overview of estimated body temperatures show that April is still too cold for the lizard to be actively roaming and hunting. In May, its body temperature is just slightly higher than the temperature threshold of 20°C, when the animal becomes active. In summer, the estimated monitor body temperature is close to the optimal values; and in September the estimated body temperature falls almost to the hibernation threshold of 20°C. Applying the equations developed by Islam et al. (2015) for soil temperature at a depth of 30 cm, we estimated soil-temperature ranges as 4.1 – 5.75°C for February and 6.3 – 9.4°C for the coldest quarter. The wintering shelters of the Desert Monitor are located at least twice as deep (60 – 200 cm), where the thermal inertia of the soil provides relative stability of temperatures throughout the year (Petrov, 1973). Thus, our rough approximation of the Desert Monitor’s body temperature, derived from estimation of the soil temperature at the surface and at 20 cm depth during the “key” months, confirms the model data and the reliable model operational mode as a whole.
Precipitation, humidity and the impact of other variables
Other factors, which trigger the stages of the life-cycle, are photoperiod and precipitation (Auffenberg et al., 1998). Temperature appears to be most important, since it defines both the individual reactions of a single animal and the changes in the stages of the life-cycle. Population density and species distribution can also be affected by environmental parameters like seasonal and behavioral parameters. Furthermore, energy-related factors such as dietary shift and mode of life (i.e., arboreality, terrestriality, aquatic) may also influence the magnitude and dynamics of varanid populations (Arida, 2008). V. griseus is more plentiful in more humid zones (~6 per 1 km2) than in arid zones (~2 per 1 km2) in the Sahara Desert (Vernet, 1982, cited after Ilgaz et al., 2008). In Uzbekistan, the density of the Desert Monitor is relatively higher within the foothill valleys (0.37 specGha) than in the open sandy soils and ridge sands (0.08 specGha) (Bondarenko, 1989). Some key variable ranges, such as precipitation in the warmest week, precipitation in the driest quarter and the relative air humidity of certain months and quarters, represent, obviously, the optimal ranges or lower limits for both V. griseus wellbeing and vegetation growth. The correlation of air and soil temperatures to the soil moisture was shown for different climatic conditions and soil depths and found to be strong (Jin and Mullens, 2014; Pinheiro et al., 2000; Wang et al., 2016). However, we do not have enough field data (measured soil moisture) to provide a reliable estimation of soil moisture values in the areas of V. griseus distribution as we did with soil and body temperatures.
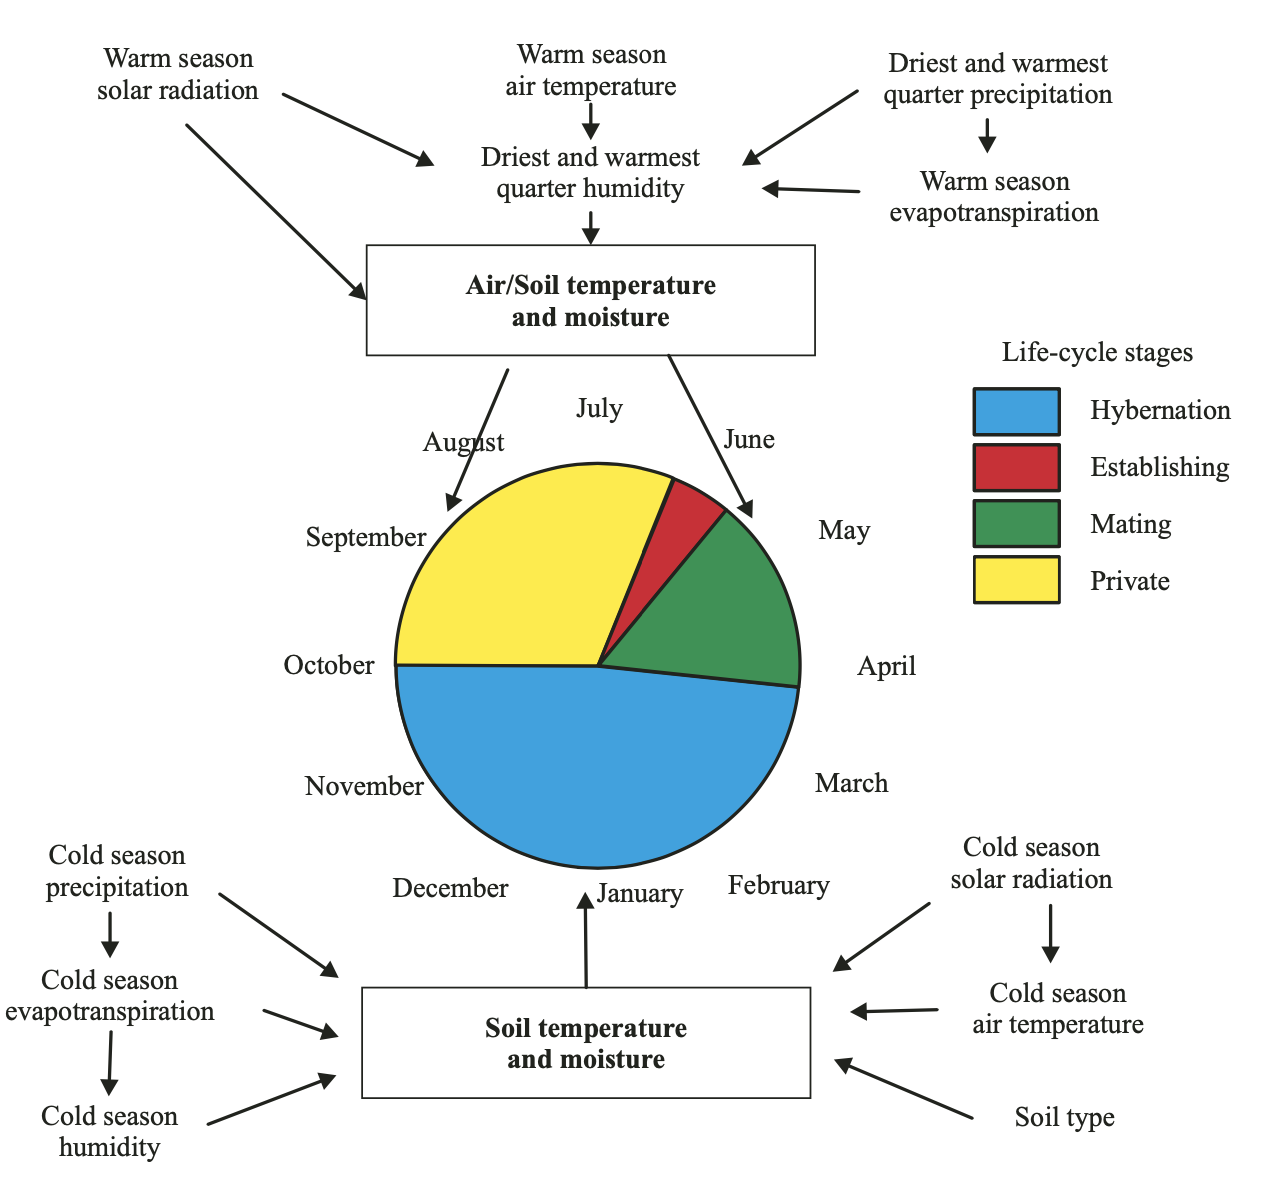
It is obvious that neither a single variable nor a full set of variables can be discussed without understanding of the close and multiple relationships and cross-regulations of variables to each other and to the animal.
Figure 2 represents an extremely simplified scheme of the interaction of abiotic variables and their summary impact on the annual cycle of the Desert Monitor.
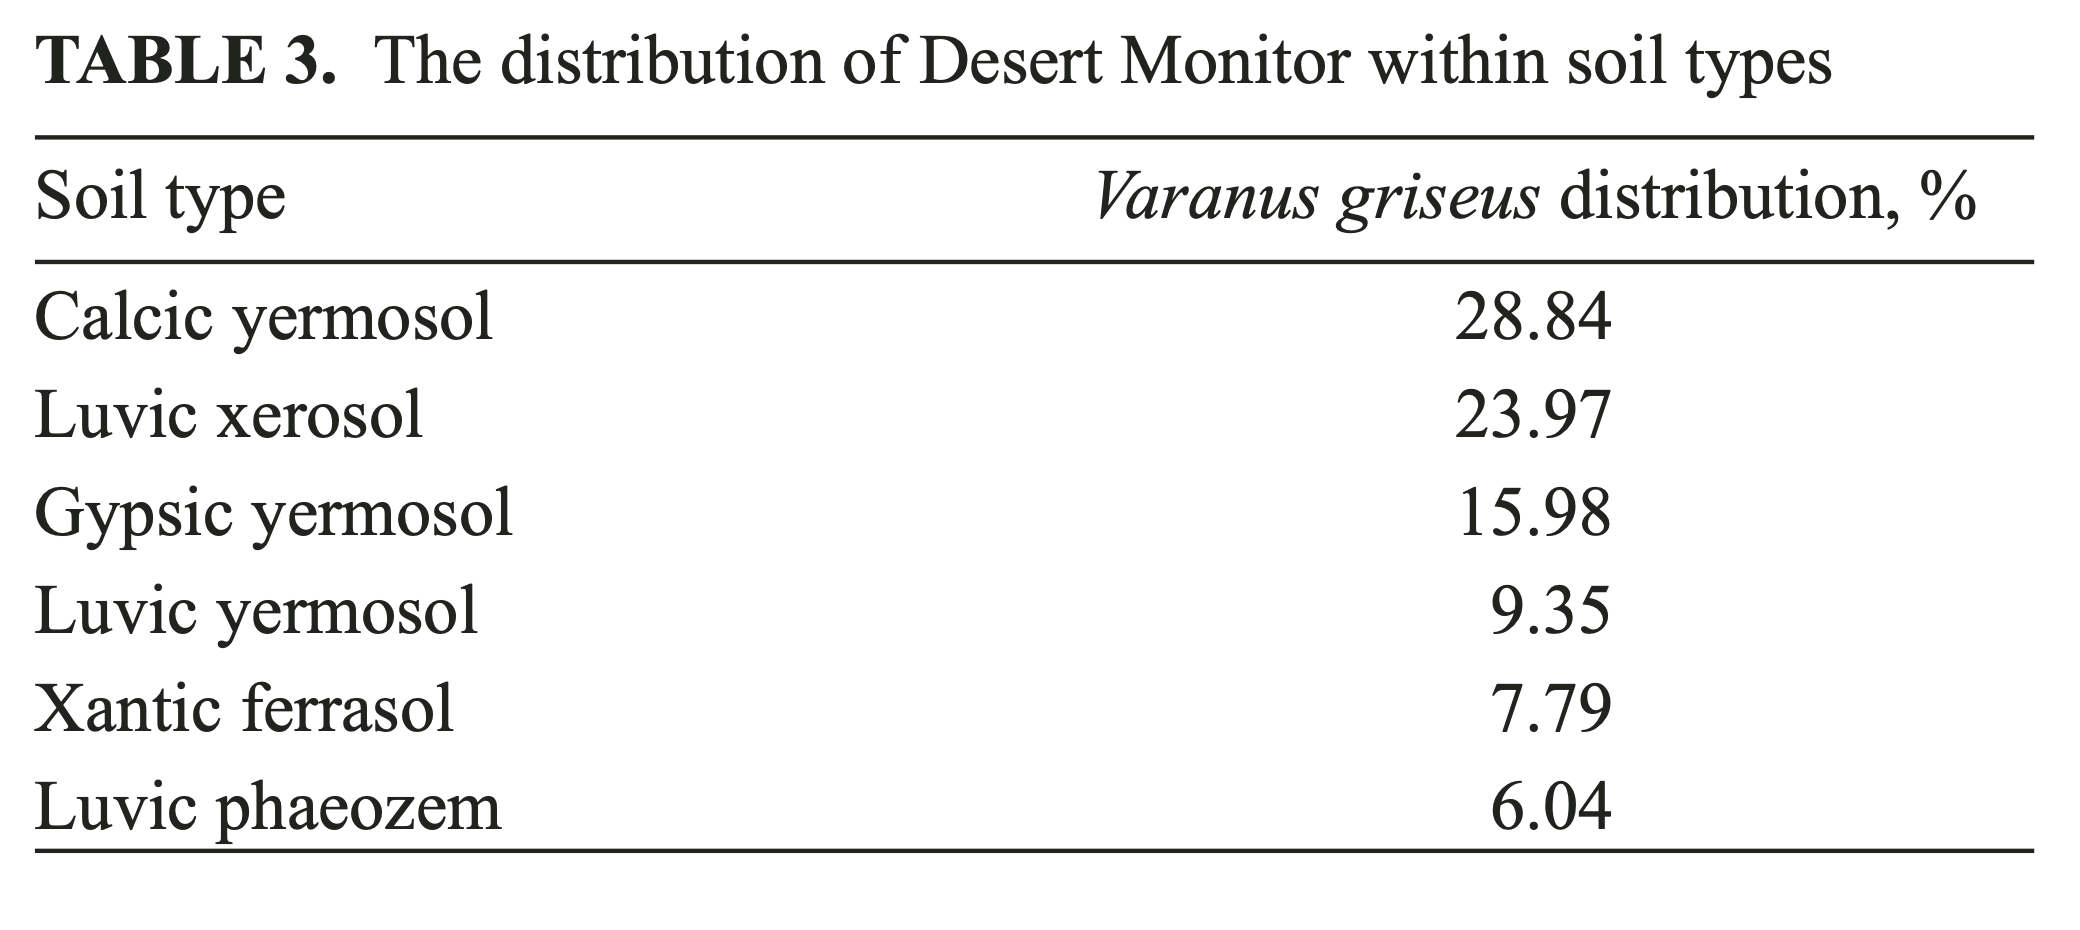
Additional data on soil types and properties, acquired from https:GGdaac.ornl.gov, allowed an analysis of the frequency distribution of the documented locations of V. griseus within a selected dataset. We used the following soil datasets to perform the analysis: “soil type” (following FAO (1961 – 1965) and Zobler (1986) classifications); “soil density”; and “sand content at 30 cm soil depth.” The distribution of the known V. griseus localities within soil types revealed the following percentages (Table 3).
Yermosols, comprising as much as 54% of all soil types where the Desert Monitor was documented, are desert grey to brown-colored soils with significant calcic and gypsic sub horizons. Xerosol (24%) is another type of desert grey-colored soils, related to yermosol, characterized by prominent clayish horizon beneath the surface. All soil types mentioned are characterized by low humus concentration and reduced biological activity (Kovda, 1973).
Percentile analysis of soil-density preferences for the Desert Monitor reveal that the species is to be found mostly in moderately dense soils (1.48 – 1.65 gGcm3). A percentile analysis of the sand content in the upper 30 cm of the soil horizon revealed a wide range (38.8 – 85.2%) of sand content in the soil. Comparing soil density, sand content and soil types, it is obvious that the Desert Monitor prefers fixed soils with no open sands; and this analysis confirms the previously published data on the distribution of the animal in the wild.
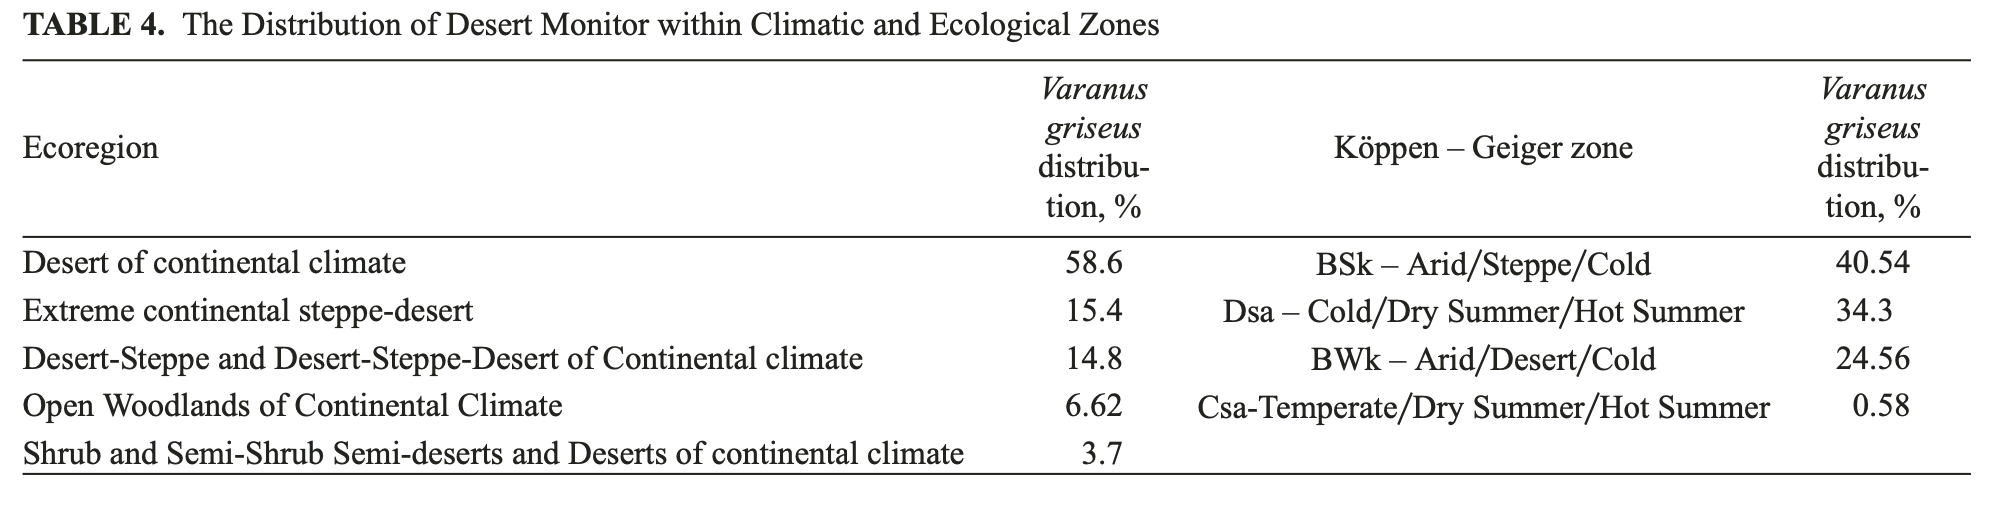
Climatic zonation was analyzed as a separate part of the study, as the georeferenced grids of climatic zonation were not included in the initial dataset prior to modeling. Table 4 demonstrates the distribution of the Desert Monitor within ecological regions and the Köppen-Geiger classification of climates (source data https:GGdaac. ornl.gov).
Most of records for the Desert Monitor (89%) are associated with Desert and Steppe-Desert environment. Regarding the updated Köppen-Geiger classification (see Kottek et al., 2006), most of the Monitor records resemble zones of BSk and Dsa (75%). A significant part of the records falls within the BWk zone of Köppen-Geiger, which in general corresponds to Takla-Makan conditions, where the Monitor has never been documented. The Takla-Makan Desert and a part of Azerbajan territory were classified according to SDM as moderately suitable for the Desert Monitor. However, there are no reports of the presence of the Desert Monitor in these territories. The Takla-Makan Desert is one of the biggest sandy deserts in the world. It represents an accumulation type of desert with predominantly aeolic sands up to 300 meters thick (Petrov, 1973) and high dunes with almost no vegetation. Only peripheral areas may have some vegetated or clayish parcels altering the sandy dunes. The Takla-Makan Desert is characterized as extra-arid territory (Petrov, 1973), with less than 50 mm of precipitation annually. In contrast, the Central Asian Deserts correspond to a temperate continental climate according to Petrov (1973), or the BSK and Dsa zones described by Koppen-Geiger. The Kyzylkum Desert is composed of Neogene sandstones, clays and conglomerates. The destruction of bedrocks resulted in plains, covered with pebble or sand. The lack of vegetation and loose sands of the Takla-Makan explains very well the absence of the Monitor in the area. However, “nihil est ab omni parte beatum”; and moderate suitability in the areas of Takla-Makan and Azerbajan would, probably, provide the explanation for the inconsistency in the recent model, arising from an incomplete set (see above) of input data. The current model should be significantly improved by future research, taking into consideration biotic (food, competition, vegetation etc.,) and abiotic variables recently unavailable for the analysis due to the impossibility of representing many of the variables as georeferenced grids.
CONCLUSION
The Species Distribution Model, developed with simple (our study) or complex, machine-learning statistical approaches, has a great advantage in allowing the key variables to be distinguished from the entire set of input abiotic variables. In the current paper, we have identified a relationship between most of the key variables for V. griseus, as revealed by SDM, and actual data on the species biology, basing on the information on the biology of this, relatively well-studied, species. However, some variables remain questionable (see Table 1). Any ectothermic species experiences environmental temperature as one of the most serious limiting factors. Temperature may affect the animal directly, providing the limitations of animal viability are derived from physiological constraints. However, temperature influences and helps to define other important environmental conditions, like soil and air humidity, via complicated dependences, requiring, in most cases, detailed study and additional experiments within a certain area. Relative air humidity has, obviously, no direct influence on an animal whose skin is impermeable to water. The impact of relative air humidity to V. griseus is apparently indirect and should be related to the interrelationships between a variety of abiotic variables, ranging from soil and air temperature, soil moisture, to solar radiation and probably other variables, unaccounted for in the recent model. Moreover, all variables studied may affect the lizard indirectly, influencing the vegetation condition, the abundance and species diversity of insects and small mammals, the pattern of activity on the part of V. griseus, etc. The recent model provides a good insight into the applicability of Species Distribution Modeling for species ecology study and, particularly, determining the impact of peculiar abiotic variables on the life-cycle stages of the animal. Another aspect of the SDM application is the ability of SDM to delimit area where new finds of species are much more probable. Species Distribution Modelling, being carried out as an interdisciplinary approach, provides a better understanding of the relationships between the biotic and abiotic components of the environment and the species-specific influence of the variables. SDM may highlight new questions and problems in terms of the biology of the given species that otherwise may have remained hidden; and, in general, leads to a better comprehension of the global processes in the biosphere.
Acknowledgments. Our thanks are due to B. M. Gubin, M. V. Pestov, J. A. Zima, D. Nuridzhanov and T. Abduraupov for field data on registration of Varanus griseus caspius. T. N. Dujsebayeva provided extended and useful discussions on early manuscript draft. J. A. Zima and D. Nuridzhanov made some useful comments on manuscript. We are grateful to R. Sim for English correction (http:GGwww.expert-english. com). The study was funded by grant 2200GGF4 “Demographic analysis of Desert Monitor (Sauria: Reptilia) populations in Kazakhstan” (Ministry of Education and Science, Republic of Kazakhstan) and Rufford’s Fund grant 19111-2 “Development of measures for the conservation of the Desert Monitor in Kazakhstan and Uzbekistan.”
REFERENCES
- Aguilar M. and Lado C. (2012), “Ecological niche models reveal the importance of climate variability for the biogeography of protosteloid amoebae,” ISME J., 6, 1506 – 1514.
- Ahmad M. F. and Rasul G. (2008), “Prediction of soil temperature by air temperature; a case study for Faisalabad,” Pak. J. Meteorol., 5(9), 19 – 27
- Ananjeva N. B. and Golynsky E. A. (2013), “Analysis of distribution of the turkestan rock agama, Paralaudaki alehmanni (Òikolsky, 1896): using of Maxent modeling,” Tr. ZIN RAN, 317(4), 426 – 437.
- Arida E. (2008), “An overview on the ecology of Varanid Lizards,” Zoo Indonesia, 17(2), 67 – 82.
- Atayev Ch. (1985), Reptiles of Turkmenistan Mountains, Yilym, Ashgabat [in Russian].
- Auffenberg W., Rehman H., Iffat F., and Perveen Z. (1988), “Notes on the biology of Varanus griseus Koniecznyi et Mertens (Sauria; Varanidae),” J. Bombay Nat. Hist. Soc., 87, 26 – 36.
- Ayala D., Costantini C., Ose K., Kamdem G. C., AntonioNkondjio C., Agbor J.-P., Awono-Ambene P., Fontenille D., and Simard F. (2009), “Habitat suitability and ecological niche profile of major malaria vectors in Cameroon,” Malaria J., 8, 307.
- Babar S., Amarnath G., Reddy C. S., Jentsch A., and Sudhakar S. (2012), “Species distribution models: ecological explanation and prediction of an endemic and endangered plant species (Pterocarpus santalinus L. f.),” Curr. Sci., 102(8), 1157 – 1165.
- Bennet D. (1995), A Little Book of Monitor lizards. A Guide to the Monitor Lizards of the World and their Care in Captivity, Viper Press, Aberdeen.
- Beaumont L. J., Hughes L., and Poulsen M. (2005), “Predicting species distributions: use of climatic parameters in BIOCLIM and its impact on predictions of species’ current and future distributions,” Ecol. Model., 186, 250 – 269.
- Bogdanov O. P. (1960), The Fauna of Uzbek SSR, Izd. AN UZSSR, Tashkent [in Russian].
- Bondarenko D. A. (1989), “The distribution and density of Desert Monitor in Karsha Steppe,” Byull. MSN Ser. Biol., 94(3), 24 – 32 [in Russian].
- Booth T. H., Nix H. A., Busby J. R., and Hutchinson M. F. (2014), “BIOCLIM: the first species distribution modelling package, its early applications and relevance to most current MAXENT studies,” Divers. Distr., 20, 1 – 9.
- Böhme W., Ehrlich K., Milto K., Orlov N., and Scholz S. (2015), “A new species of Desert Monitor lizard (Varanidae: Varanus: Psammosaurus) from the western Zagros region (Iraq, Iran),” Russ. J. Herpetol., 22(1), 41 – 52.
- Brushko Z. K. (1995), Lizards of Kazakhstan deserts, Konzhyk, Almaty [in Russian].
- Doronin I. V. (2012), “The use of GIS to analyze the distribution of rock lizards of the complex Darevskia (saxicola) (Sauria: Lacertidae),” Curr. Stud. Herpetol., 12(3 – 4), 91 – 122
- .
- Dujsebayeva T. N., Malakhov D. V., and Cherednichenko A. V. (2014), “The prognosis of dynamics for rare amphibian species under climatic change scenario,” in: 1st Int. Sci. and Pract. Conf. “Desertification of Central Asia: Assessment, Forecast, Management,” Astana, pp. 206 – 211 [in Russian].
- Dujsebayeva T. N. and Malakhov D. V. (2017), “The Model of Ranodon sibiricus Ecological Niche: GIS and Remote Sensing Approach,” Russ. J. Herpetol., 24(3), 171 – 192.
- Escoriza D., Ferrer J., Amat F. and Tarragó A. (2011), “Nova citaiaspectesecològics del varà del desert Varanus griseus (Sauria: Varanidae) al Sahara Occidental,” Bull. Soc. Cat. Herpetol., 19, 70 – 74.
- FAO (1961 – 1965), World Soil Resources Reports, Roma, pp. 1 – 17, 1961 – 1965.
- Franklin J. (2012), Mapping species: Distributions. Spatial inference and Prediction, Department of Geography and the Environment, University of Texas, Austin, Texas, USA.
- Graham C. H. and Hijmans R. J. (2006), “A comparison of methods for mapping species ranges and species richness,” Glob. Ecol. Biogeogr., 15, 578 – 587.
- Groff L. A., Marks S. B., and Hayes M. P. (2013), “Using ecological niche models to direct rare amphibian surveys: a case study using the Oregon spotted frog (Rana pretiosa),” Herpetol. Conserv. Biol., 9(2), 354 – 368.
- Hijmans R. J., Cameron S. E., Parra J. L., Jones P. G., and Jarvis A. (2005), “Very high resolution interpolated climate surfaces for global land areas,” International Journal of Climatology, 25, 1965 – 1978.
- Hutchinson G. E. (1957), “Concluding remarks,” Cold Spring Harbor Symp. Quant. Biol., No. 22, 415 – 427. Reprinted in 1991: Class. Theor. Biol. Bull. Math. Biol., 53, 193 – 213.
- Ibrahim A. A. (2000), “A radiotelemetric study of the body temperature of Varanus griseus (Sauria: Varanidae) in Zaranik Protected Area, North Sinai, Egypt,” Egypt. J. Biol., 2, 57 – 66.
- Ilgaz Ç., Kumlutaþ Y., Avcý A., Baran Ý., and Özdemir A. (2008), “The morphology and distribution of Varanus griseus (Daudin, 1803) (Reptilia: Sauria: Varanidae) in southeastern Anatolia,” Russ. J. Herpetol., 15(3), 173 – 178.
- Islam K. I., Khan A., and Islam T. (2015), “Correlation between Atmospheric Temperature and Soil Temperature: A Case Study for Dhaka, Bangladesh,” Atmosph. Climate Sci., 5, 200 – 208.
- Jin M. S. and Mullens T. (2014), “A Study of the Relations between Soil Moisture, Soil Temperatures and Surface Temperatures Using ARM Observations and Offline CLM4 Simulations,” Climate, 2, 279 – 295.
- Kayijamahe E. (2008), Spatial Modelling of Mountain Gorilla (Gorilla beringei beringei) Habitat Suitability and Human Impact. PhD Thesis, International Institute for Geo-Information Science and Earth Observation, Enschede, Netherlands.
- Khafagi O., Hatab E. E., and Omar K. (2012), “Ecological Niche Modeling as a Tool for Conservation Planning: Suitable Habitat for Hypericumsinaicum in South Sinai, Egypt,” Univ. J. Env. Res. Technol., 2(6), 515 – 524.
- Kottek M., Grieser J., Beck C., Rudolf B., and Rubel F. (2006), “World Map of the Köppen-Geiger climate classification updated,” Meteorol. Zeitschr., 15(3), 259 – 263. Kovda V. A. (1973), The Principles of Pedology. Vol. 1, Nauka, Moscow [in Russian].
- Kriticos D. J., Webber B. L., Leriche A., Ota N., Macadam I., Bathols J., and Scott J. K. (2012), “CliMond: global high-resolution historical and future scenario climate surfaces for bioclimatic modelling,” Meth. Ecol. Evol., 3, 53 – 64. doi: 10.1111Gj.2041-210X.2011.00134.x.
- Leviton A. E. and Anderson S. C. (1970). “The amphibians and reptiles of Afganistan, a checklist and key to the herpetofauna,” Proc. Calif. Acad. Sci. 4th Ser., 38(10), 163 – 206.
- Litvinchuk S. N., Crottini A., Federici S., De Pous P., Donaire D., Andreone F., Kaleziæ M. L., Dukiæ G., Lada G. A., Borkin L. J., and Rosanov J. M. (2013), “Phylogeographic patterns of genetic diversity in the common spadefoot toad, Pelobates fuscus (Anura: Pelobatidae), reveals evolutionary history, postglacial range expansion and secondary contact,” Org. Divers. Evol. doi: 10.1007G s13127-013-0127-5.
- Litvinchuk S. N., Schepina N. A., Munkhbaatar M., Munkhbayar Kh., Borkin L. J., Kazakov V. I., and Skorinov D. V. (2014), “Distribution and conservation status of the far eastern tree frog, Hyla japonica Günther, 1859 In Mongolia And Transbaikalia (Russia),” Russ. J. Herpetol., 21(4), 303 – 314.
- Lozier J. D., Aniello P., and Hickerson M. J. (2009), “Predicting the distribution of Sasquatch in western North America: anything goes with ecological niche modelling,” J. Biogeogr. doi: 10.1111Gj.1365-2699.2009.02152.x.
- Malakhov D. V. and Dujsebayeva T. N. (2014), “High endemism of Ranodon sibiricus (Amphibia: Urodela: Hynobiidae): evidences from GIS and Remote Sensing Data,” in: Proc. of the Int. Symp. on Biol. Resources Protection and Management in the Arid Central Asia, Urumqi, Xinjiang, pp. 6 – 7.
- Malakhov D. V., Tsychuyeva N. Yu., and Vitkovskaya I. S. (2017), “Modelling the ecological niche of wheat septoriosis using remote sensing data,” Curr. Probl. Remote Sensing Of The Earth From Space, 14(1), 113 – 124. doi: 10.21046G 2070-7401-2017-14-1-113-124.
- Mertens R. (1954), “Die Rassen von Varanus griseus,” Senckenberg. Biol., 35, 353 – 357.
- Nuridzhanov D. A., Chirikova M. A., Pestov M. V., and Zima Yu. A. (2016), “New data on the population condition of Desert Monitor Varanus griseus caspius (Eichwald, 1831) in Uzbekistan,” in: Proc. “Current problems of rare, endangered and poorly-studied species preservation in Uzbekistan,” Tashkent, pp. 154 – 158 [in Russian].
- O’Donnell M. S. and Ignizio D. A. (2012), Bioclimatic Predictors for Supporting Ecological Applications in the Conterminous United States, U. S. Geological Survey, Reston, Virginia.
- Okafor A. I. (2010), “The influence of body temperature on sprint speed and anti-predatory defensive responses of the North African Monitor lizard, Varanus griseus,” Afr. J. Biotechnol., 9(5), 778 – 781.
- Paraskiv K. P. (1956), Reptiles of Kazakhstan, Almaty, [in Russian].
- Parra J. L., Graham C. C., and Freile J. F. (2004), “Evaluating alternative data sets for ecological niche models of birds in the Andes,” Ecography, 27, 350 – 360.
- Peterson A. T. and Robins C. R. (2003), “Using Ecological-Niche Modeling to Predict Barred Owl Invasions with Implications for Spotted Owl Conservation,” Conserv. Biol., 17(4), 1161 – 1165.
- Petrov M. P. (1973), Deserts of the Earth, Nauka, Leningrad, [in Russian].
- Pianka E. R. (1994), “Comparative ecology of Varanus in Great Victoria Desert,” Austral. J. Ecol., 19, 195 – 408.
- Pinheiro A. C., Tucker C. J., Entekhabi D., Privette J. L., and Berry J. A. (2000), “Assessing the relationship between surface temperature and soil moisture in southern Africa,” Remote Sensing and Hydrology 2000. Proc. Symp. Santa Fe, New Mexico, USA.
- Pocheville A. (2015), “The ecological niche: History and Recent Controversies,” in: T. Heams et al. (eds.), Handbook of Evolutionary Thinking in the Sciences, pp. 547 – 586. doi: 10.1007G978-94-017-9014-7-26.
- Puzirjeva A. A. (1975), Climatic Zoning of Southern Kazakhstan, Nauka, Alma-Ata [in Russian].
- Raxworthy C. J., Ingram C. M., Rabibisoa N., and Pearson R. G. (2007), “Applications of Ecological Niche Modeling for Species Delimitation: A Review and Empirical Evaluation Using Day Geckos (Phelsuma) from Madagascar,” Syst. Biol., 56(6), 907 – 923.
- Ray N., Lehmann A., and Joly P. (2002), “Modeling spatial distribution of amphibian populations: a GIS approach based on habitat matrix permeability,” Biodivers. Conserv., 11, 2143 – 2165.
- Rood E., Ganie A. A., and Nijman V. (2010), “Using presence-only modelling to predict Asian elephant habitat use in a tropical forest landscape: implications for conservation,” Divers. Distr., 16, 975 – 984.
- Rushton S. P., Ormerod S. J., and Kerby G. (2004), “New paradigms for modelling species distributions?” J. Appl. Ecol., 41, 193 – 200.
- Sanchez I., Liria J., and Feliciangeli M. D. (2015), “Ecological Niche Modeling of Seventeen Sandflies Species (Diptera, Psychodidae, Phlebotominae) from Venezuela,” Int. J. Zool. doi: 10.1155G2015G108306.
- Sindaco R. and Jeremèenko V. K. (2008), The Reptiles of Western Palearctic. 1. Annotated chechlist and distributional atlas of the turtles, crocodiles, amphisbaenians and lizards of Europe, North Africa, Middle East and Central Asia, Edizioni, Belvedere.
- Skorinov D. V., Doronin I. V., Kidov A. A., Tuniyev B. S., and Litvinchuk S. N. (2014), “Distribution and conservation status of the caucasian newt, Lissotriton lantzi (Wolterstorff, 1914),” Russ. J. Herpetol., 21(4), 251 – 268.
- Stanner M. (2004), “Varanus griseus,” in: E. Pianka, D. King (Eds.) Varanoid Lizards of the World, Indiana Univ. Press.
- Tarkhnishvili D., Serbinova I., and Gavashelishvili A. (2009), “Modelling the range of Syrian spadefoot toad (Pelobates syriacus) with combination of GIS-based approaches,” Amphibia–Reptilia, 30, 401 – 412.
- Thompson G. G., Pianka E. R., and de Boer M. (1998), “Body temperatures of an arboreal Monitor lizard, Varanus tristis (Squamata: Varanidae) during the breeding season,” Amphibia–Reptilia, 20, 82 – 88.
- Tsellarius A. Yu. and Cherlin V. A. (1994), “The duration of Varanus griseus (Reptilia, Sauria) eggs incubation and the dates of hatchlings emerging in sandy deserts of Middle Asia,” Selevinia, 4, 43 – 46 [in Russian].
- Tsellarius A. Yu., Cherlin V. A., and Menshikov Y. A. (1991), “Preliminary report on the study of biology of Varanus griseus (Reptilia, Varanidae) in Middle Asia,” Herpetol. Res., 1, 61 – 103.
- Tsellarius A. Yu. and Menshikov Y. G. (1994), “Indirect communications and its role in the formation of social structure in Varanus griseus (Sauria),” Russ. J. Herpetol., 1(2), 121 – 132.
- Tsellarius E. Yu. and Tsellarius A. Yu. (1997), “Temperature conditions of Desert Monitor (Varanus griseus, Reptilia, Sauria) activity,” Zool. Zh., 76(2), 206 – 211, [in Russian].
- Tupikov A. I. and Ukrainsky P. A. (2016), “The ñomparative analysis of different approaches to the modeling of the species’ areal in the Maxent programme (by example of dione snake and steppe viper),” Nauch. Ved. Ser. Estestv. Nauki, 225(4), 71 – 84 [in Russian].
- Tytar V. M. and Nekrasova O. D. (2016), “Species distribution modeling of the Caspian Whipsnake Dolichophis caspius (Squamata: Serpentes): a tool for ranking conservation priorities in the western Pontic steppe,” Vestn. SPbU. Ser. 3. Biol., 3, 144 – 149, [in Russian].
- Waltari E., Hijmans R. J., Peterson A. T., Nyari A. S., Perkins S. L., and Guralnick R. P. (2007), “Locating Pleistocene Refugia: Comparing Phylogeographic and Ecological Niche Model Predictions,” PLoS ONE, 2(7), e563. doi: 10.1371Gjournal.pone.0000563.
- Wang W., Rinke A., Moore J. C., Ji D., Cui X., Peng S., Lawrence D. M., McGuire A. D., Burke E. J., Chen X., Decharme B., Koven C., MacDougall A., Saito K., Zhang W., Alkama R., Bohn T. J., Ciais P., Delire C., Gouttevin I., Hajima T., Krinner G., Lettenmaier D. P., Miller P. A., Smith B., Sueyoshi T., and Sherstiukov A. B. (2016), “Evaluation of air-soil temperature relationships simulated by land surface models during winter across the permafrost region,” The Cryosphere, 10, 1721 – 1737.
- Wikramanayake E. D. (1995), “Activity and thermal ecophysiology of two sympatric Monitor lizards in Shri Lanka,” J. South Asian Nat. Hist., 1(2), 212 – 224.
- Zarudny N. A. (1915), “Reptiles of the Aral Sea,” Izv. Turk. Otd. Russ. Geogr. Soc. Supplement to Aral Sea expedition results, XII, 113 – 125 [in Russian].
- Zheng D., E. Hunt R., and Running S. W. (1993), “A daily soil temperature model based on air temperature and precipitation for continental applications,” Clim. Res., 2, 183 – 191.
- Zobler L. (1986), A World Soil File for Global Climate Modeling. Technical Memorandum 87802, NASA Goddard Institute for Space Studies GISS., New York, NY.